Statistics and figures for sequencing library: HS1814 (Frontal_Ampl)
Summary of input lanes for this library
Basic info is provided for each lane of data comprising this library
| Flowcell-Lane | Read Length | Quality Reads | Source Dir |
| 61B1LAAXX_Lane5 | 2 x 76 | 43,009,462 | /projects/analysis/analysis5/HS1814/61B1LAAXX_5/basecalls/ |
| 61B1LAAXX_Lane6 | 2 x 76 | 44,135,227 | /projects/analysis/analysis5/HS1814/61B1LAAXX_6/basecalls/ |
| 612FUAAXX_Lane6 | 2 x 76 | 36,726,217 | /projects/analysis/analysis5/HS1814/612FUAAXX_6/bustard/ |
Summary of sequence statistics for each lane
Basic statistics for each lane of sequence data are summarized below. 'Low quality' refers to reads with too many ambiguous bases (N's). 'Low complexity' refers to homopolymeric (e.g. polyA tails) or other sequences of low complexity identified by 'mdust'. 'R1' and 'R2' refers to the first and second read of a paired-end read.
| Flowcell-Lane | Paired Reads | Low Quality (R1 | R2) | Low Complexity (R1 | R2) | Passing (R1 | R2) | Total Bases | Passing Bases |
| 61B1LAAXX_Lane5 | 22,858,693 | 5.16% | 5.05% | 0.78% | 0.85% | 94.05% | 94.10% | 3,474,521,336 | 92.81% |
| 61B1LAAXX_Lane6 | 23,441,079 | 5.08% | 4.97% | 0.81% | 0.86% | 94.11% | 94.17% | 3,563,044,008 | 92.81% |
| 612FUAAXX_Lane6 | 18,926,001 | 2.25% | 2.07% | 0.79% | 0.83% | 96.96% | 97.10% | 2,876,752,152 | 96.25% |
Summary of read assignments by assignment class
The assignment of reads to each read class is summarized below for the entire library. 'Unassigned' reads could not be assigned with high confidence to any known or predicted transcriptome or genome sequence. This does not mean that they had no significant similarity, only that they could not be assigned with high confidence. In this table, reads are summarized as individual reads (not paired reads)
| Read Class | Read Count | Percent of Total |
| Total read count | 130,451,552 | 100% |
| Read1-Read2 identical | 566 | 0.00% |
| Low complexity | 1,071,243 | 0.82% |
| Low quality (>1 N) | 5,508,831 | 4.22% |
| Ensembl transcript | 56,036,110 | 42.96% |
| Ensembl transcript (ambiguous) | 5,488,521 | 4.21% |
| Novel exon junction | 668,667 | 0.51% |
| Novel exon junction (ambiguous) | 14,307 | 0.01% |
| Novel exon boundary extension | 2,477,725 | 1.90% |
| Novel exon boundary extension (ambiguous) | 416,373 | 0.32% |
| Intron | 9,850,899 | 7.55% |
| Intron (ambiguous) | 97,497 | 0.07% |
| Intergenic | 3,742,669 | 2.87% |
| Intergenic (ambiguous) | 41,818 | 0.03% |
| Repeat element | 1,520,346 | 1.17% |
| Repeat element (ambiguous) | 605,015 | 0.46% |
| Unassigned | 42,910,959 | 32.89% |
Summary of mapping results for each lane
The mapping of reads to genome and transcriptome sequences is summarized below on a lane-by-lane basis. Only reads mapped with high confidence are summarized here. Reads mapped to each sequence type were assigned unambiguously. Reads mapping ambiguously (i.e. map equally well to multiple places) are summarized in the last column.
| Flowcell-Lane | Total | Transcript | Novel junction | Novel boundary | Intron | Intergenic | Repeat element | Ambiguous |
| 612FUAAXX_Lane6 | 25,028,071 | 69.45% | 0.83% | 3.19% | 11.74% | 4.46% | 2.01% | 8.31% |
| 61B1LAAXX_Lane5 | 27,614,221 | 69.11% | 0.83% | 3.01% | 12.35% | 4.69% | 1.82% | 8.19% |
| 61B1LAAXX_Lane6 | 28,317,655 | 69.10% | 0.82% | 3.00% | 12.37% | 4.70% | 1.81% | 8.20% |
| TOTAL | 80,959,947 | 69.21% | 0.83% | 3.06% | 12.17% | 4.62% | 1.88% | 8.23% |
Summary of average coverage values by feature type
The grand average coverage observed for each type of sequence feature is summarized below. Average coverage is calculated as the cumulative number of mapped bases divided by the total number of base positions in the genome (for that type of sequence feature).
| Feature Type | Average Coverage | Total Base Count | Cumulative Coverage |
| Gene | 41.31105 | 103,087,317 | 4,258,645,696 |
| Transcript | 33.55417 | 64,444,159 | 2,162,370,037 |
| ExonRegion | 41.31108 | 103,087,246 | 4,258,645,696 |
| Junction | 0.98691 | 204,920,540 | 202,238,189 |
| KnownJunction | 11.36556 | 17,657,352 | 200,685,675 |
| NovelJunction | 0.00829 | 187,263,188 | 1,552,514 |
| Boundary | 7.63981 | 37,074,326 | 283,240,774 |
| KnownBoundary | 22.98011 | 6,833,888 | 157,043,464 |
| NovelBoundary | 4.17313 | 30,240,438 | 126,197,310 |
| Intron | 0.58698 | 1,275,364,373 | 748,617,402 |
| ActiveIntronRegion | 3.32586 | 72,257,746 | 240,319,342 |
| SilentIntronRegion | 0.42257 | 1,202,399,357 | 508,092,303 |
| Intergenic | 0.17255 | 1,643,005,218 | 283,505,788 |
| ActiveIntergenicRegion | 5.83296 | 26,791,623 | 156,274,519 |
| SilentIntergenicRegion | 0.07869 | 1,616,101,525 | 127,172,733 |
Summary of expressed events by feature type
The number of sequence features of each type detected above the level of background noise are summarized below. For each feature type, the total number of features is listed, followed by the subset of these features that are expressed versus not expressed above background.
| Feature Type | Feature Count | Expressed (%) | Not Expressed (%) |
| Gene | 49,868 | 11,755 (23.57%) | 38,113 (76.43%) |
| Transcript | 134,413 | 9,230 (6.87%) | 125,183 (93.13%) |
| ExonRegion | 442,847 | 84,118 (18.99%) | 358,729 (81.01%) |
| Junction | 3,305,171 | 69,057 (2.09%) | 3,236,114 (97.91%) |
| KnownJunction | 284,797 | 67,718 (23.78%) | 217,079 (76.22%) |
| NovelJunction | 3,020,375 | 1,339 (0.04%) | 3,019,036 (99.96%) |
| Boundary | 597,974 | 44,990 (7.52%) | 552,984 (92.48%) |
| KnownBoundary | 110,225 | 22,040 (20.00%) | 88,185 (80.00%) |
| NovelBoundary | 487,750 | 22,950 (4.71%) | 464,800 (95.29%) |
| Intron | 235,634 | 2,215 (0.94%) | 233,419 (99.06%) |
| ActiveIntronRegion | 237,209 | 13,480 (5.68%) | 223,729 (94.32%) |
| SilentIntronRegion | 339,425 | 4,135 (1.22%) | 335,290 (98.78%) |
| Intergenic | 30,261 | 351 (1.16%) | 29,910 (98.84%) |
| ActiveIntergenic | 81,007 | 5,147 (6.35%) | 75,860 (93.65%) |
| SilentIntergenic | 82,083 | 1,393 (1.70%) | 80,690 (98.30%) |
| GRAND TOTAL (non-redundant) | 5,535,892 | 245,871 (4.44%) | 5,290,021 (95.56%) |
Estimates of signal-to-noise ratio
(Average coverage of exon regions / Average coverage of silent intron regions) = 97.76
(Average coverage of exon regions / Average coverage of silent intergenic regions) = 524.99
Estimates of intronic and intergenic noise levels (95th percentiles of silent intron and intergenic regions)
95th percentile of silent intron regions for library (HS1814) is: 12.48 (log2 = 3.64)
95th percentile of silent intergenic regions for library (HS1814) is: 8.86 (log2 = 3.15)
Summary of library complexity - estimated by tag redundancy per million reads and compared to other libraries
Library complexity is calculated for the sequence library by randomly sampling 1 million reads and determining the number of unique and redundant reads within the pool. This sampling is repeated (with replacement) at least 3 times and average values across these samples is used. A 'redundant' read is one where both reads of a pair have either identical sequence (first figure) or mapping location (second figure) to at least one other read in the sampled pool. In each panel below, the value for the current library is indicated by a red dot and compared to other libraries, summarized as box and whisker plots. In the first panel (green), the percent of unique reads per million reads sampled is summarized. In the second panel (orange), the percent of redundant reads per million is summarized. In the third panel (yellow), the redundant reads are further examined to determine the number of distinct redundant reads. For example, if all redudant reads corresponded to a few sequences occuring many times this would result in a low number of distinct redundant reads. A 'good' library with high complexity should have high, low, and high values for panels one, two and three respectively.
Library complexity assessed by read sequence identity
Library complexity assessed by read sequence mapping positions
Distribution of relative positions of reads mapping within known transcripts (i.e. position bias test)
The frequency of read positions are plotted against the relative position within each transcript, where 0% is the 5' end of the transcript and 100% is the 3' end. Read positions were binned according to the size of transcripts they map within and the plot is produced for each bin (i.e. reads mapping to transcripts of 0-500 bp, 500-1000 bp, ..., 15000-20000 bp, and > 20000 bp).
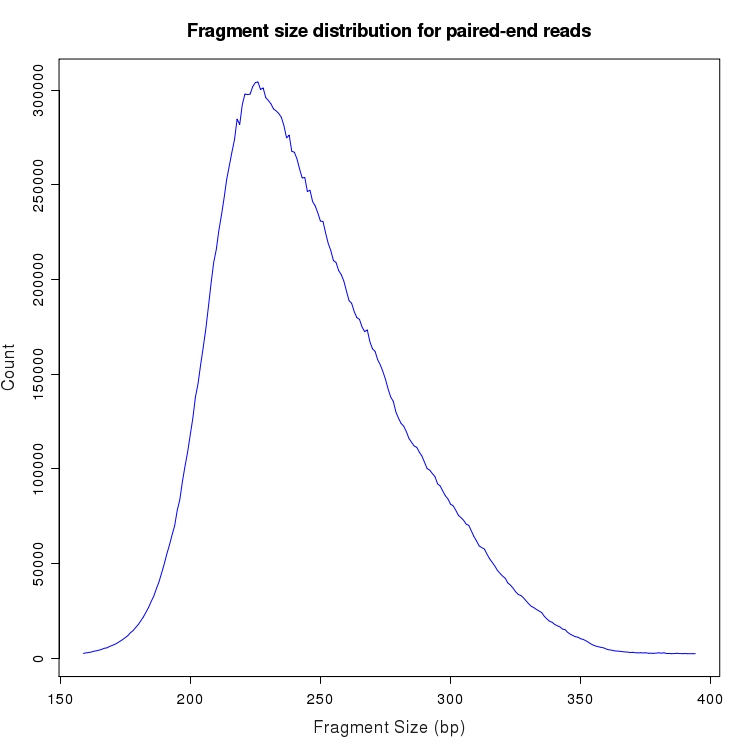
Distribution of fragment size for paired-end mappings to transcripts
The distribution of fragment sizes is plotted for all paired-end reads in which both pairs could be aligned to the transcriptome. Pairs with reads aligning to different gene loci or different chromosomes are excluded. Fragment sizes with less than 0.01% of total reads are not plotted.

Distribution % of gene bases covered for each expressed gene (at various minimum depth levels)
The distribution of percent coverage levels for each gene is summarized as a box and whisker plot. These plots are produced for six minimum depth requirements. For example, in the first plot (>=1X), the percentage of bases covered to a depth of 1X or greater is determined for each gene. If a gene is completely covered by reads from the first base to the last, at a depth of 1X or greater, then this gene is given a value of 100%. The distribution of these percent values for all genes detected above background is summarized by the box and whisker plot.

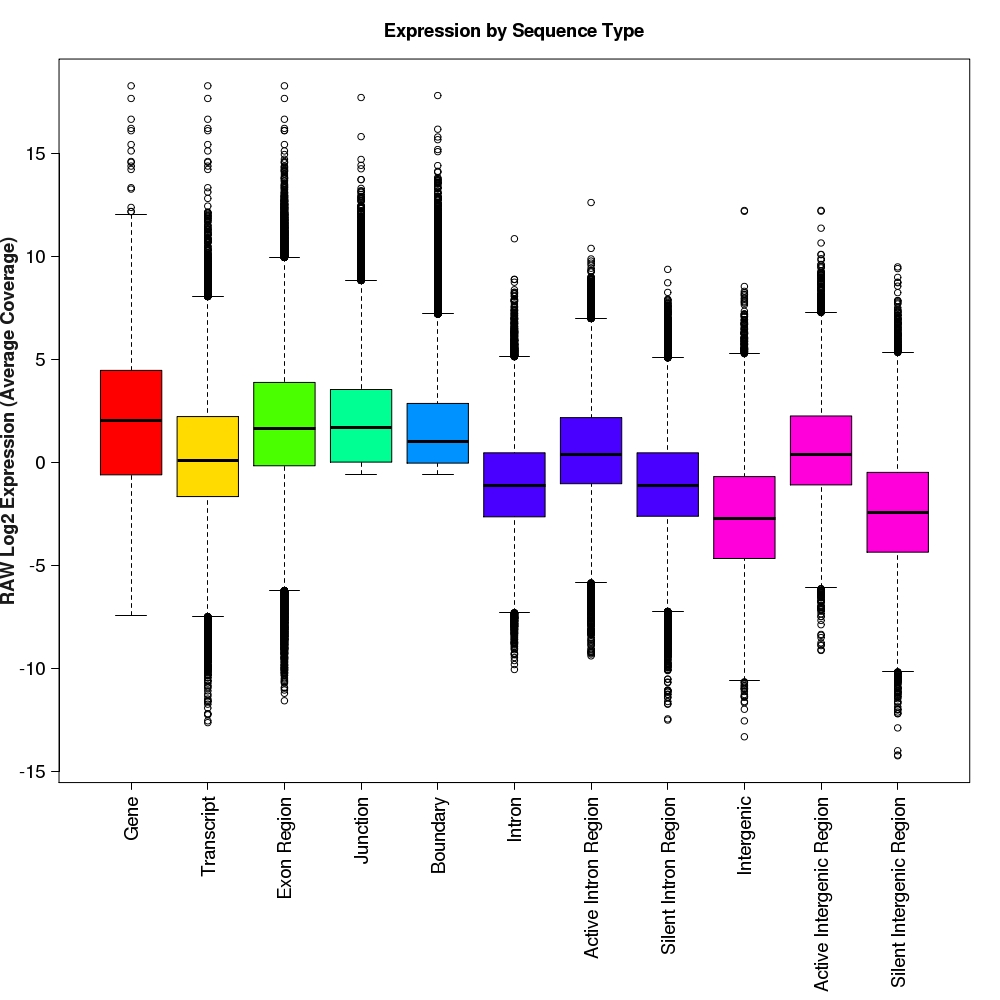
Distribution of log2 raw expression values for each feature type
Box-and-whisker plots for log2 expression values for each feature type.

Distribution of log2 normalized expression values for each feature type
Box-and-whisker plots for normalized log2 expression values for each feature type.

Density scatter plot of exon region versus gene expression values
Density scatter plot of log2 expression values for exon regions versus corresponding gene expression values.

Density scatter plot of silent intron region versus gene expression values
Density scatter plot of log2 expression values for silent intron regions versus corresponding gene expression values.

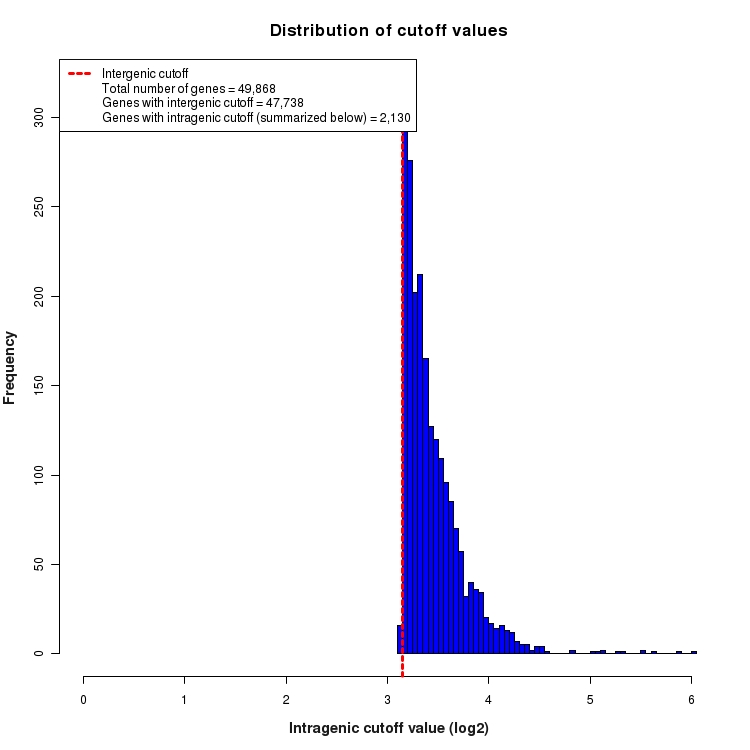
Distribution of gene-by-gene expression cutoff values
Histogram depicting the distribution of expression cutoff values used for each gene. In order to be considered 'expressed above background', all features (genes, transcripts, exons, junctions, etc.) must be expressed above the level of INTERGENIC noise. This INTERGENIC cutoff is the 95th percentile of expression values for all Silent Intergenic Regions in this library and is depicted below as a dotted red line. The number of genes for which only INTERGENIC noise is considered is provided in the legend. For features within the boundaries of highly expressed genes, additional noise is expected due to the presence of un-processed RNA contamination. For this reason, a higher INTRAGENIC cutoff is determined. These are calculated by fitting a linear model to the 95th percentile of expression values for silent intronic regions. The INTRAGENIC cutoff for a gene is then determined by using the gene expression level and the coefficients of the model fit. The distribution of the resulting gene-by-gene cutoffs is depicted below as a histogram. The number of genes that required an INTRAGENIC cutoff is also indicated in the legend.

Histograms of expression values for each feature type
Histograms depicting distribution of log2 expression values for individual feature types. The 95th percentile of expression values for silent intergenic region is depicted as a dotted line on all plots.

Percentiles plot for expression of exon regions, silent intron regions and silent intergenic regions
Percentiles plot for exon region, silent intron region and silent intergenic region expression values. The 95th percentiles of intronic and intergenic distributions are depicted as colored, dotted lines

Cumulative distribution of mean Phred score for all reads
CDF plot depicting cumulative distribution of mean Phred score for all reads broken down by R1/R2 and sequencing lane
