Miscellaneous Analyses
Bruno Grande
2017-06-26
ebv_mirnas   <- grep("BART|BHRF", rownames(mirna$raw$lcts))
ebv_patients <- rownames(annotations_mirna)[annotations_mirna$ebv_type != "None" &
                                            !rownames(annotations_mirna) %in% outliers]

mirna$ebv <- map(mirna$raw, ~ .x[ebv_mirnas, ebv_patients])
plot_heatmap(mirna$ebv$lcts, colours, annotations_mirna, cutree_row = 2,
             max_genes_to_show = 0, treeheight_row = 0)
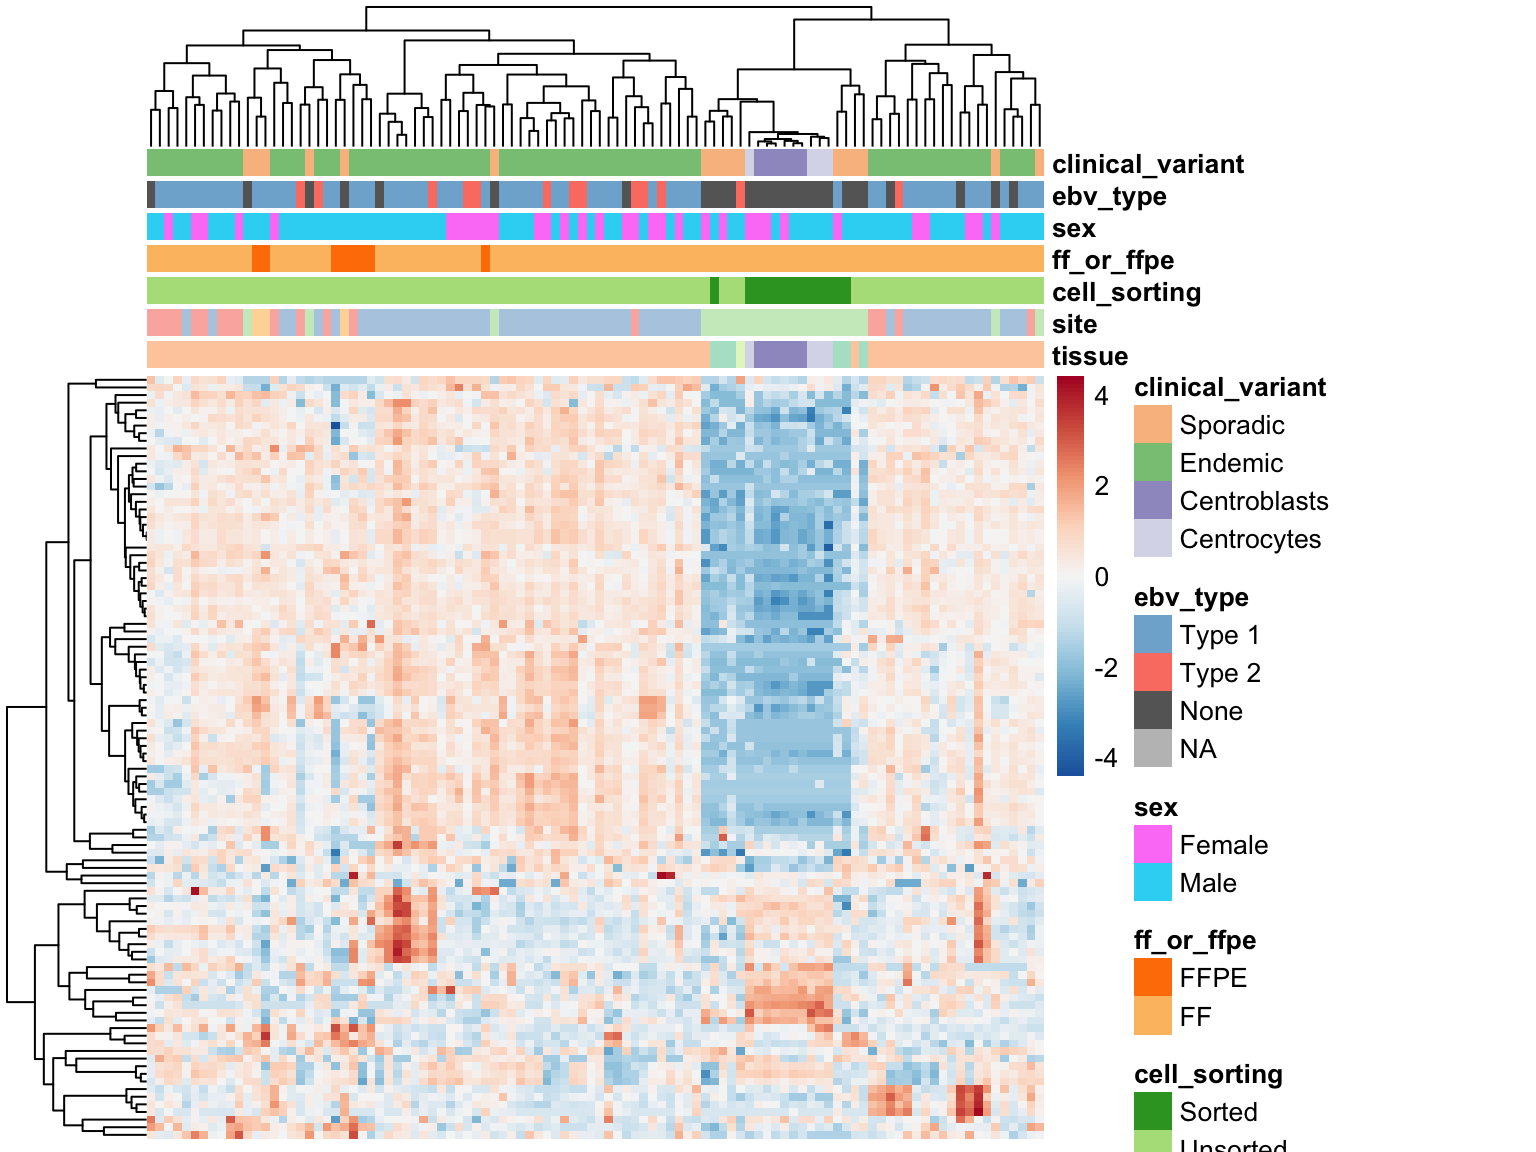
mirna$human <- map(mirna$raw, ~ .x[-ebv_mirnas,])
most_var(mirna$human$lcts, 100) %>% plot_heatmap(colours, annotations_mirna)