| ICC_class | group | n |
|---|---|---|
| BL | BL EBV- | 81 |
| BL | BL EBV+ | 107 |
| DLBCL | DZsig+ | 38 |
| DLBCL | GCB-DLBCL | 91 |
| DLBCL | UNCLASS-DLBCL | 18 |
| DLBCL | ABC-DLBCL | 79 |
| FL | FL | 89 |
| HGBCL-DH-BCL2 | HGBCL-DH-BCL2 | 124 |
MLLT1 and MLLT3 expression in B-cell lymphomas
Background
The University of Montreal team of Javier Di Noia and Noé Seija Desivo have generated mouse and cell line models demonstrating the role of two chromatin readers, MLLT1 and MLLT3, in targeting AID to chromatin to induce somatic hypermutation (SHM). They are looking to orthogonally validate some of their findings in lymphomas:
“Noe will prepare the coordinates/signal of the MLLT1 ChiP seq in RAMOS and SUDHL5 for correlation with SHM load.
“The genes we are interested are all SEC components: the two histone readers (MLLT1 and MLLT3) and three scaffolds (AFF1, AFF3, AFF4) that we find contribute to AID activity. They can form 6 different complexes by combinations of one MLLT and one AFF.
“This current manuscript we may submit in early spring (depending on our competitors timeline too) we would like to know if there is any correlation between MLLT1 or MLLT3 with AID expression and SHM load.”
They also have some data from TCGA to suggest that higher expression of MLLT1 in DLBCL is associated with inferior outcomes. Here we will examine whether MLLT1/3 expression varies across lymphomas and try to correlate it aSHM load.
Procedure
Identify samples
To examine the expression of MLLT1/3 across lymphomas, we will incorporate BL, DLBCL, HGBCL-DH-BCL2, and FL RNAseq data used in Hilton et al, 20241.
Table 1 summarizes the available RNAseq data from different lymphoma types.
Compare expression across lymphoma types
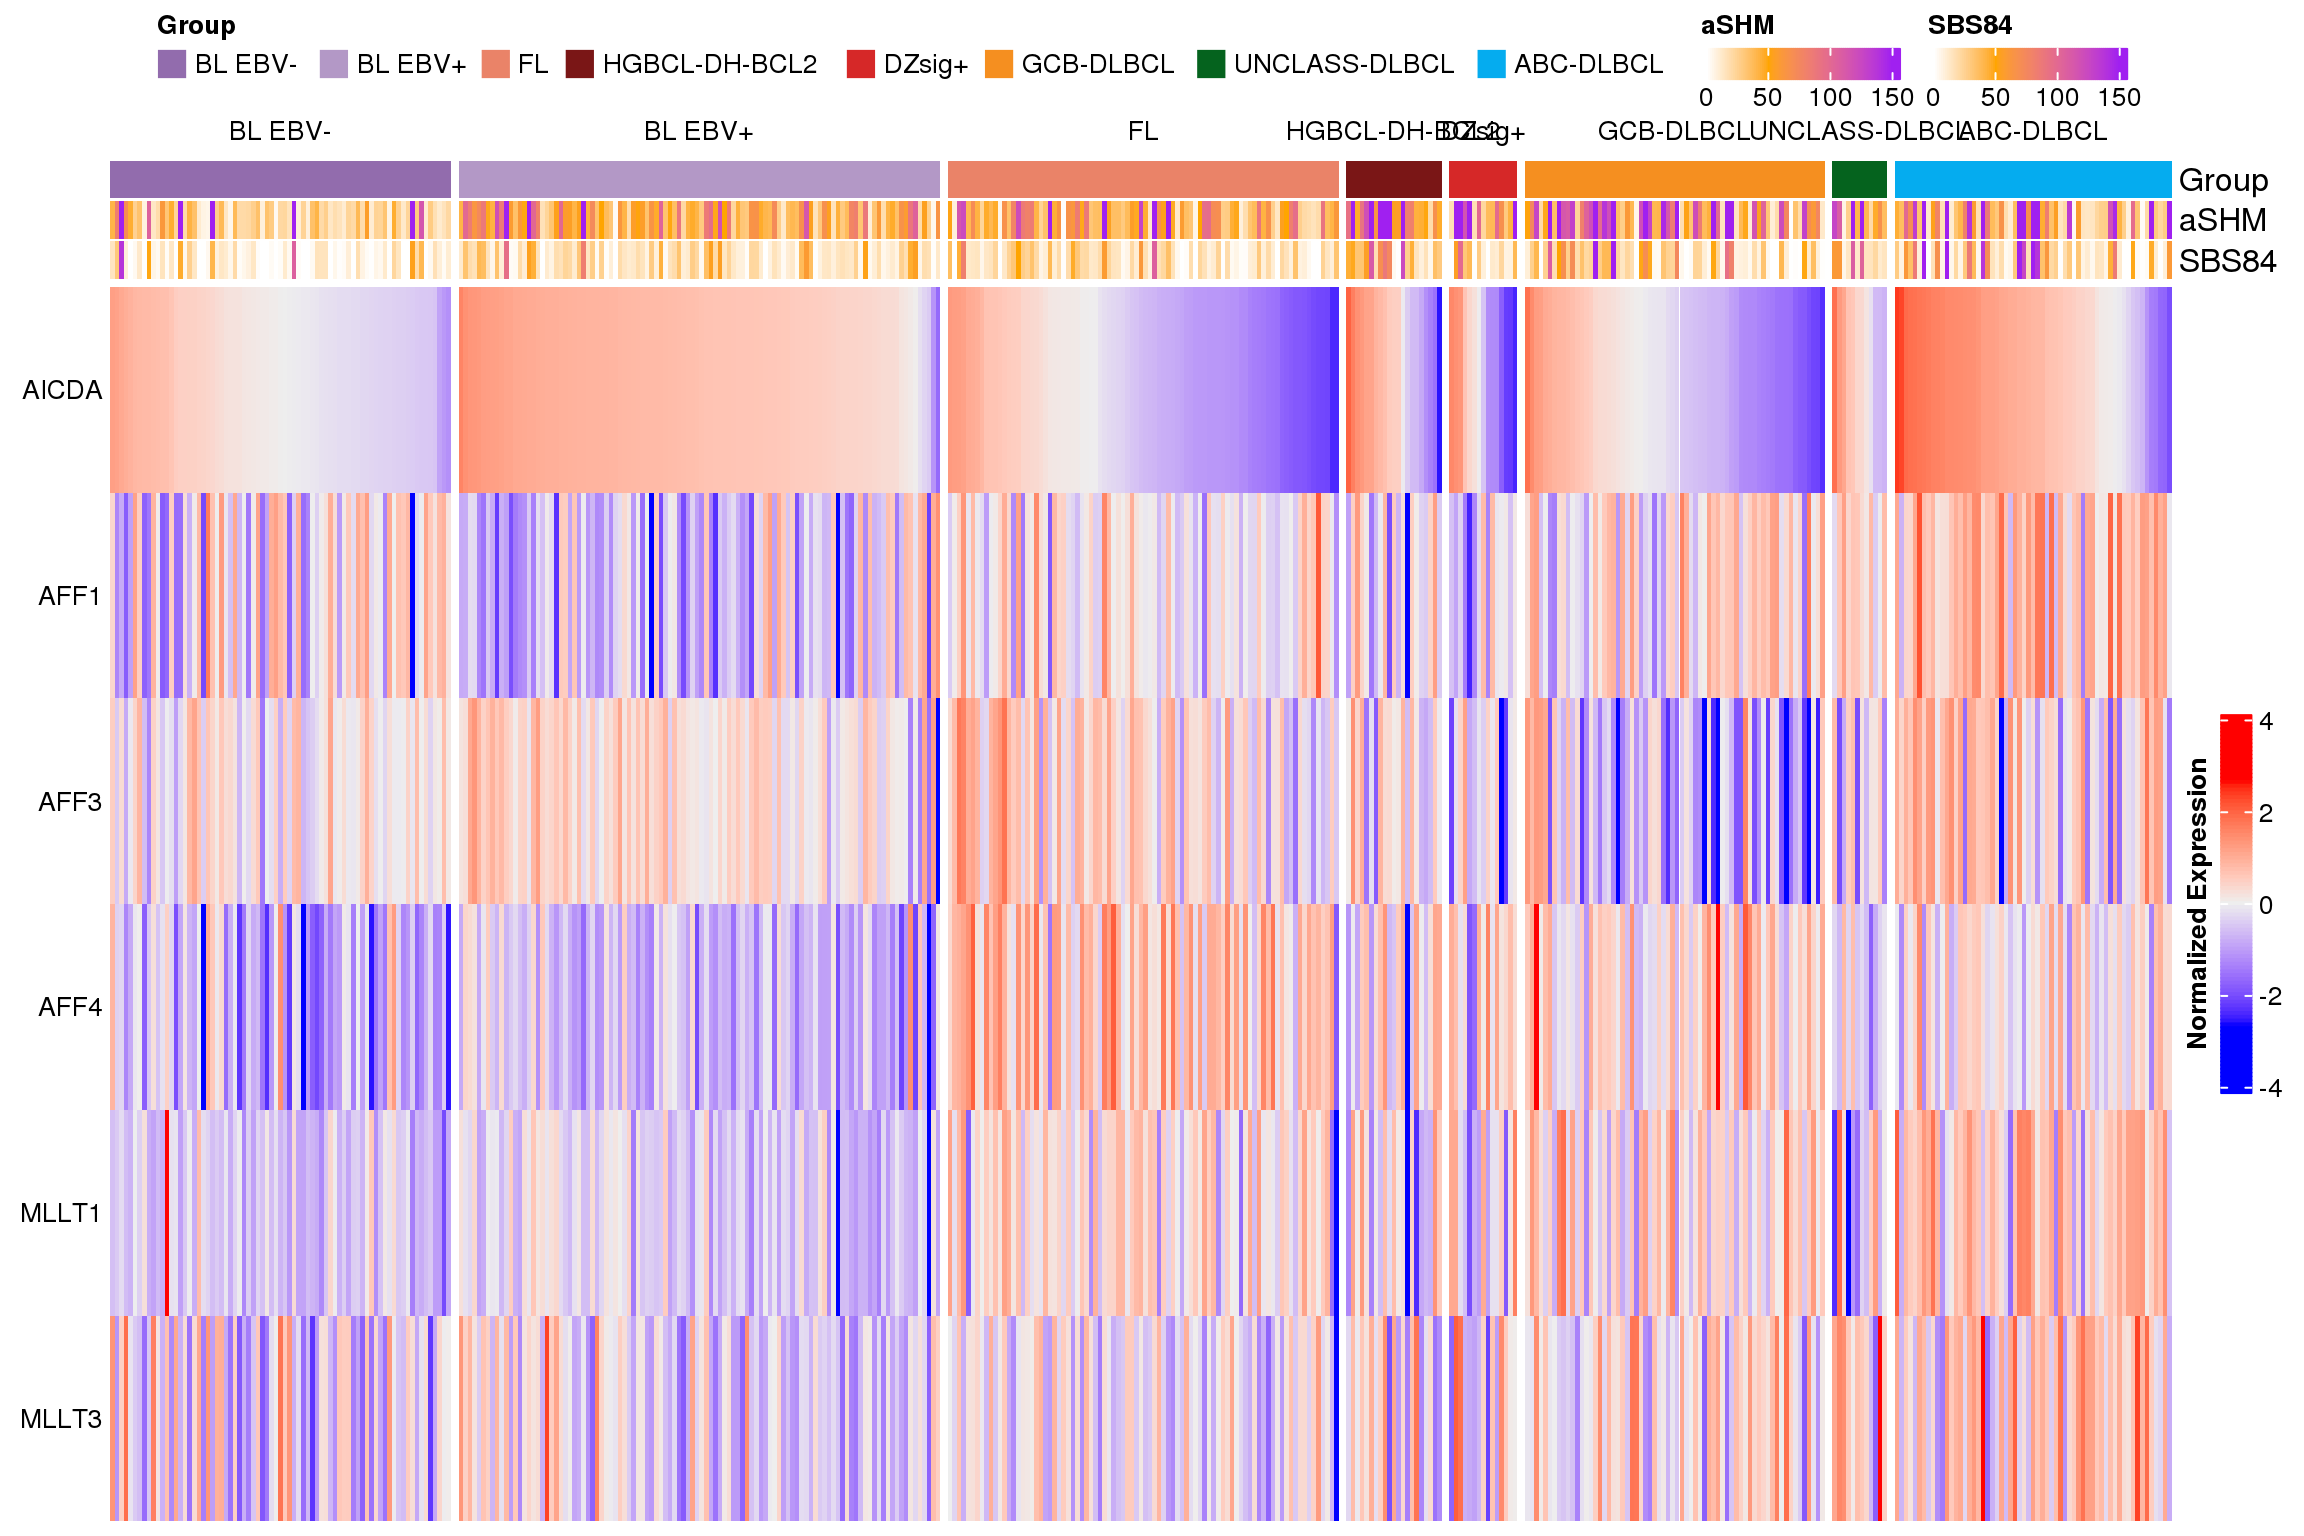
Figure 1 shows the expression of SEC genes across different lymphoma subtypes. As shown before, AICDA expression is high in BL and ABC-DLBCL. Notably MLLT1 expression is lowest in BL, which would be consistent with the globally lower rates of aSHM observed in BL.
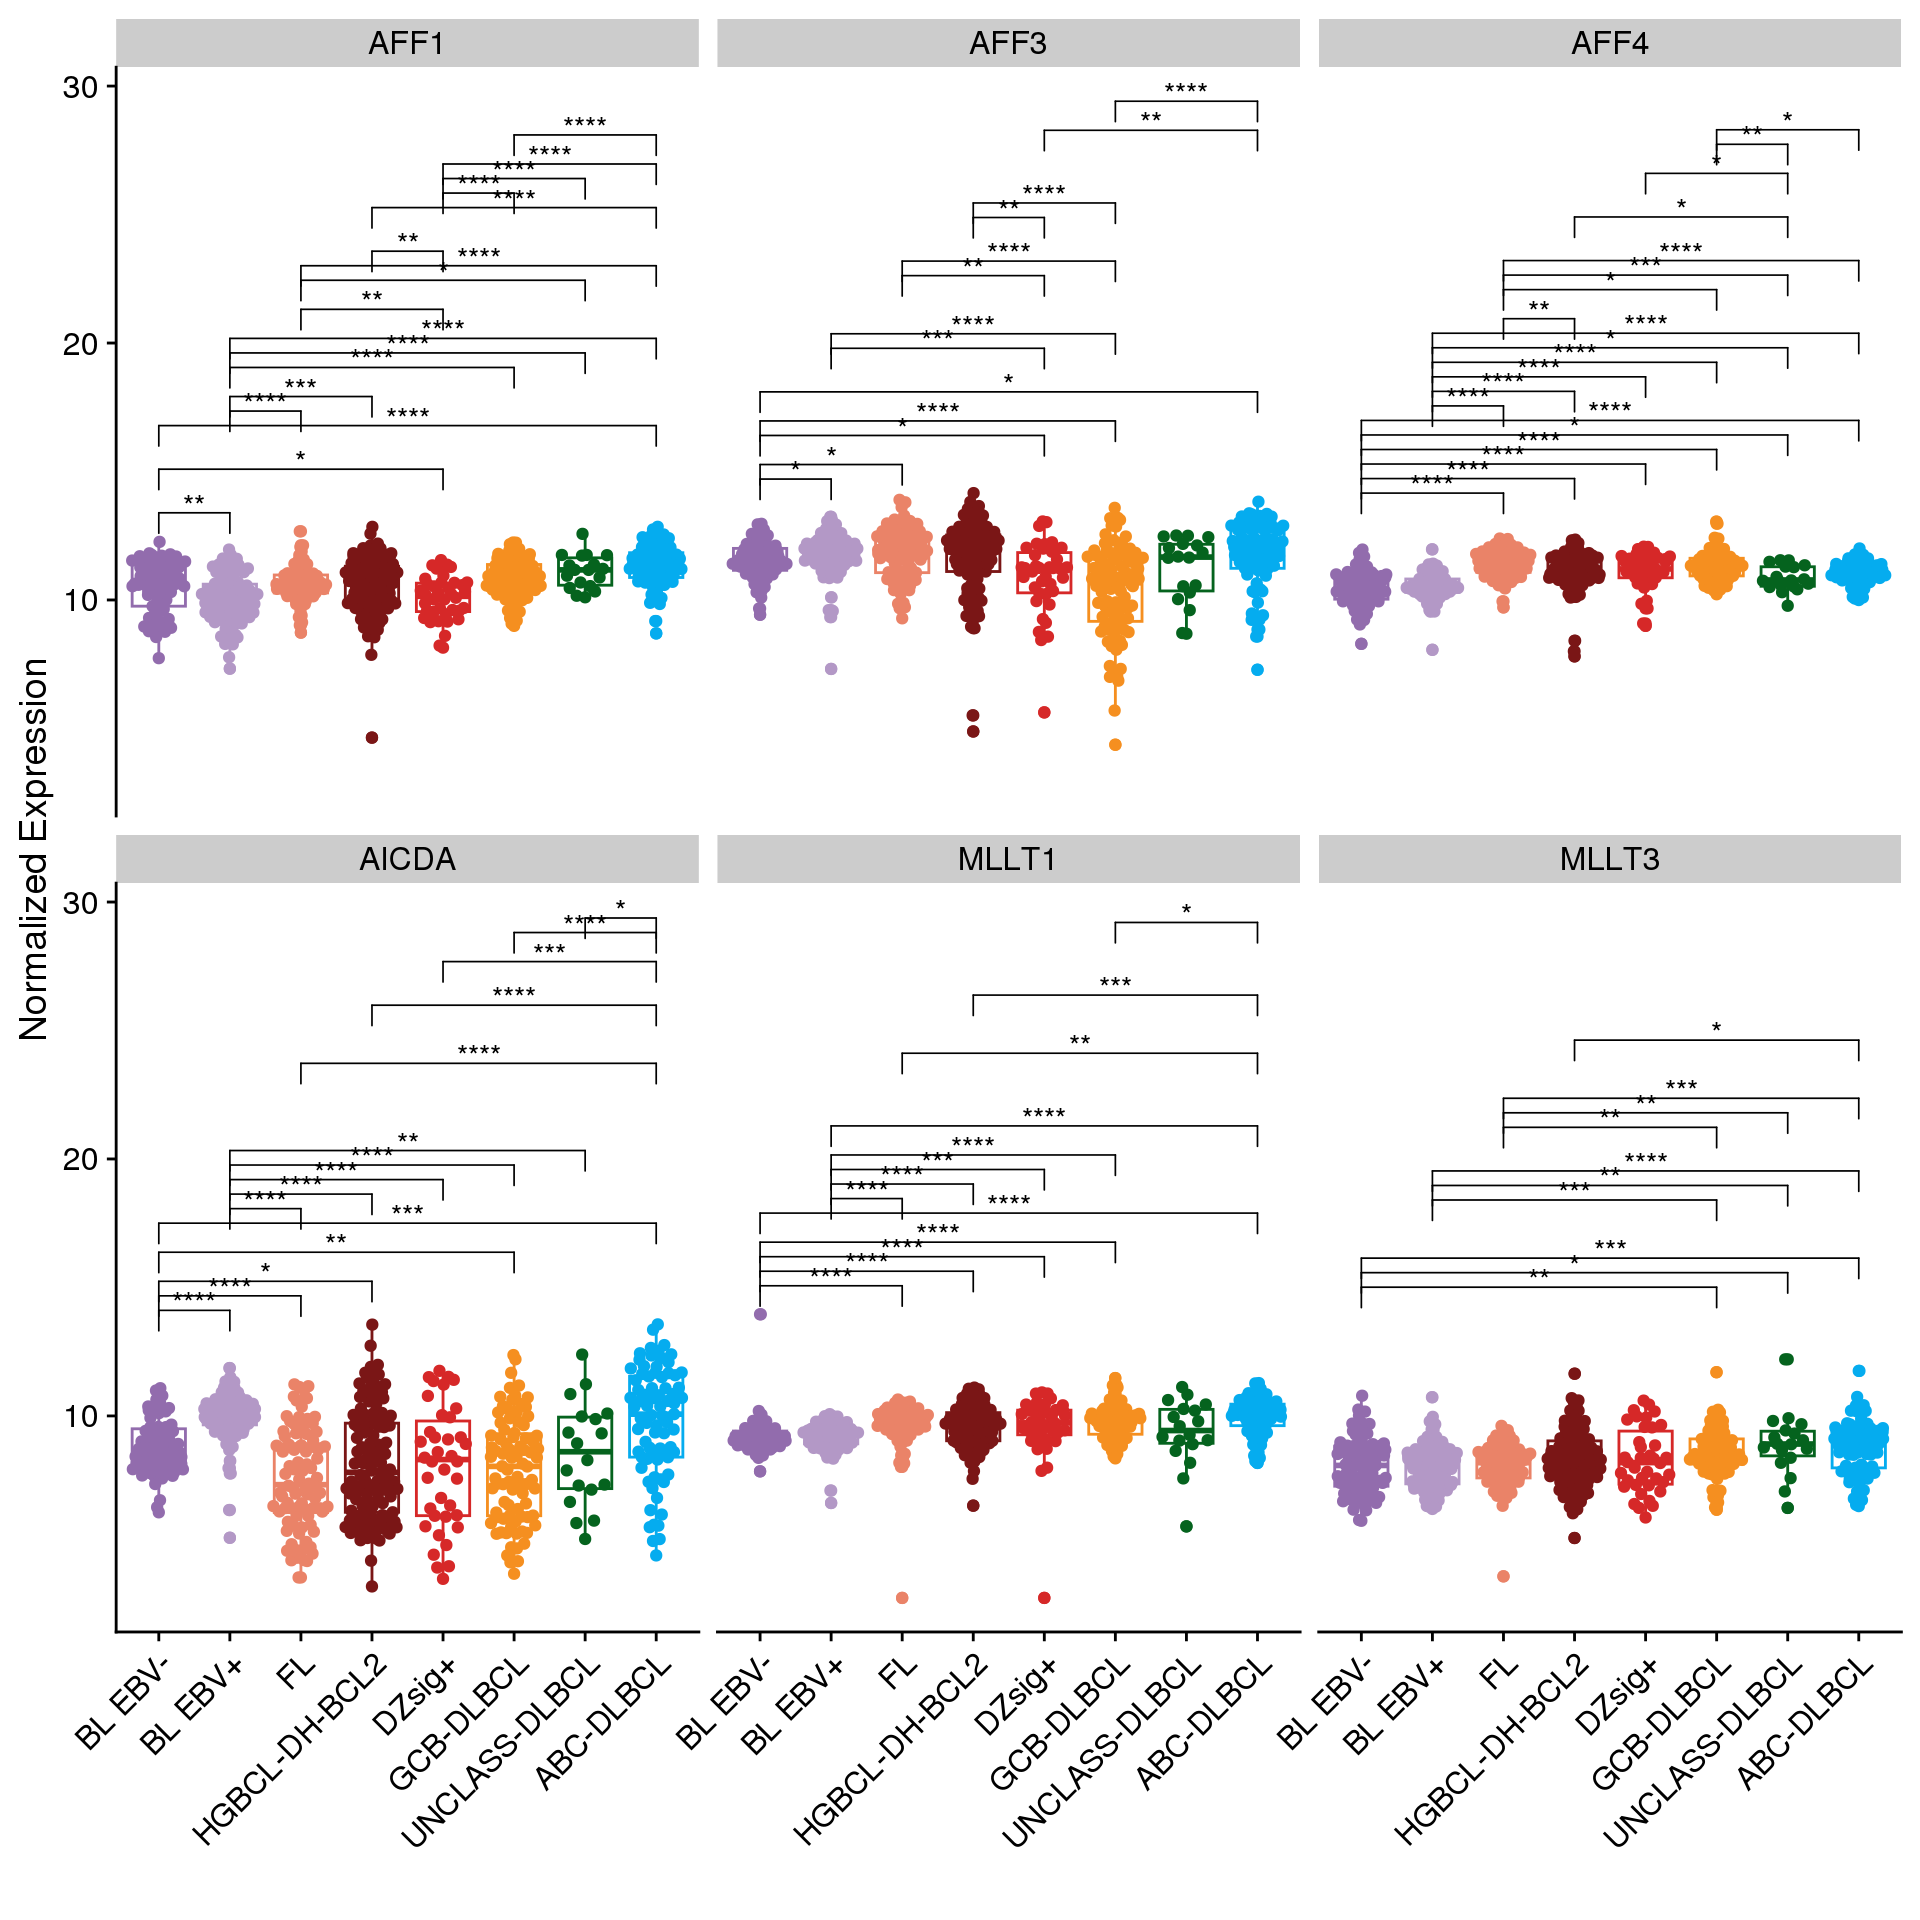
Figure 2 shows that there are no strong correlations between AICDA expression and that of any other SEC genes.
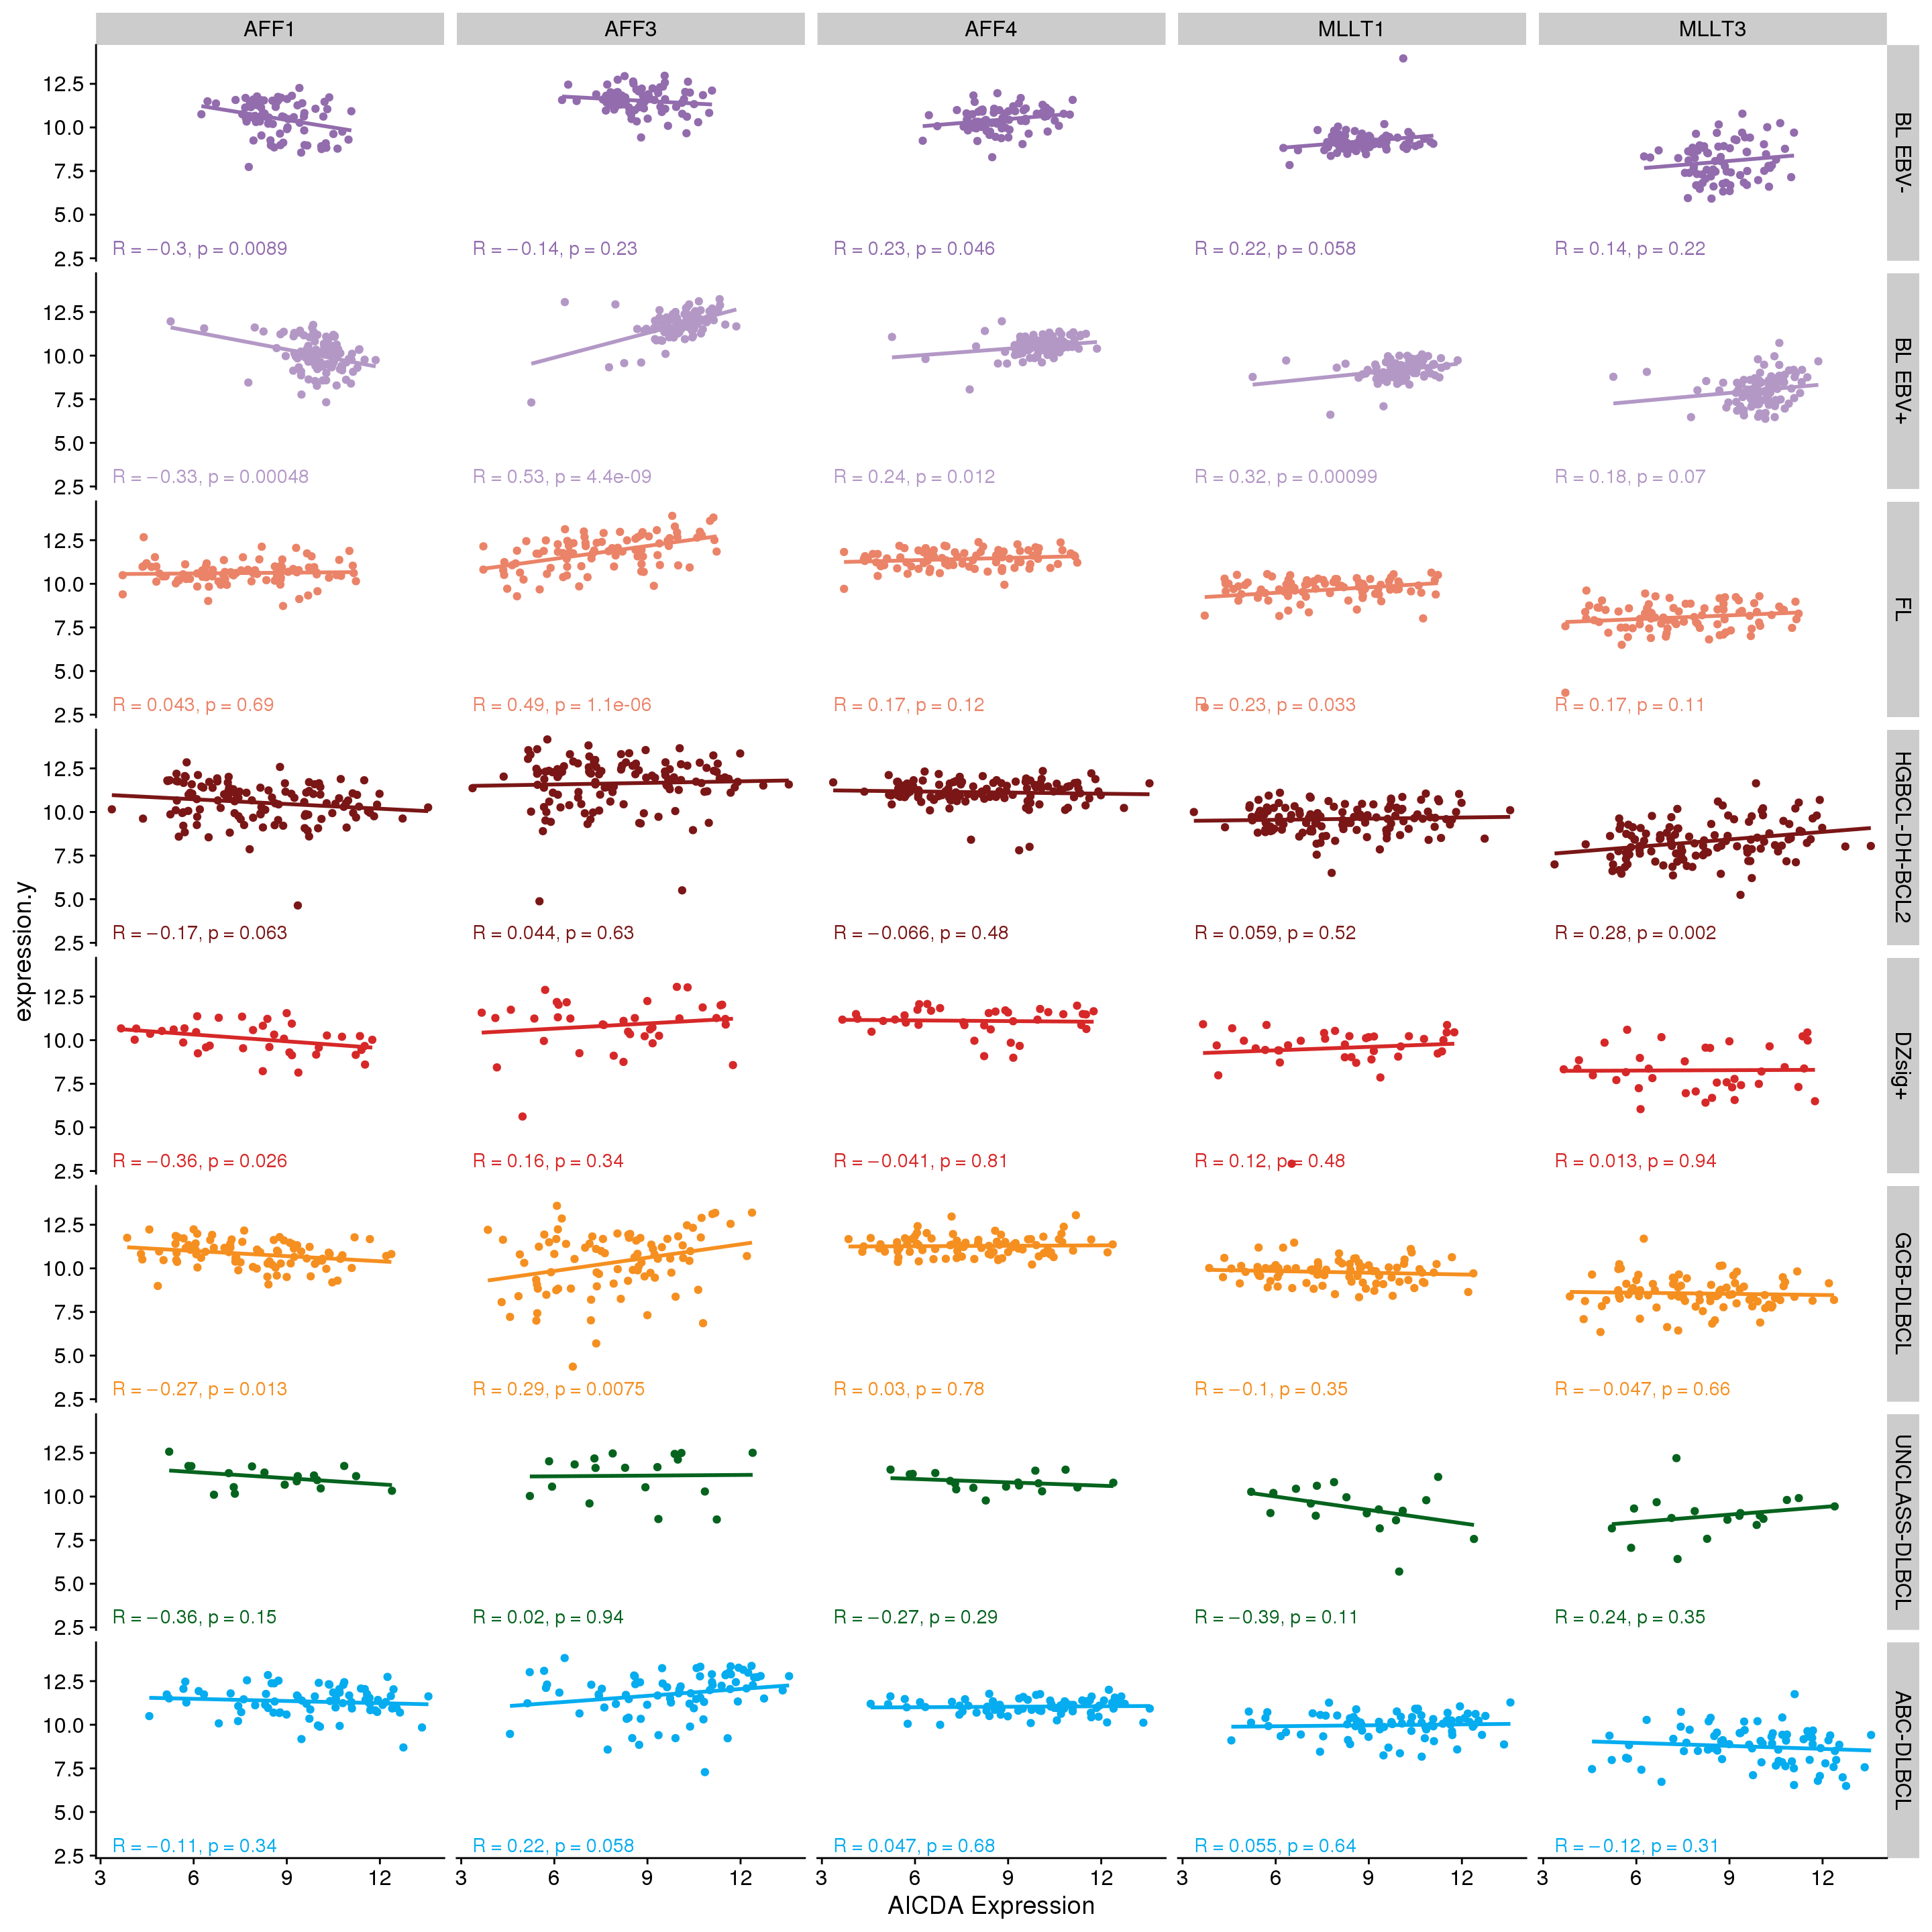
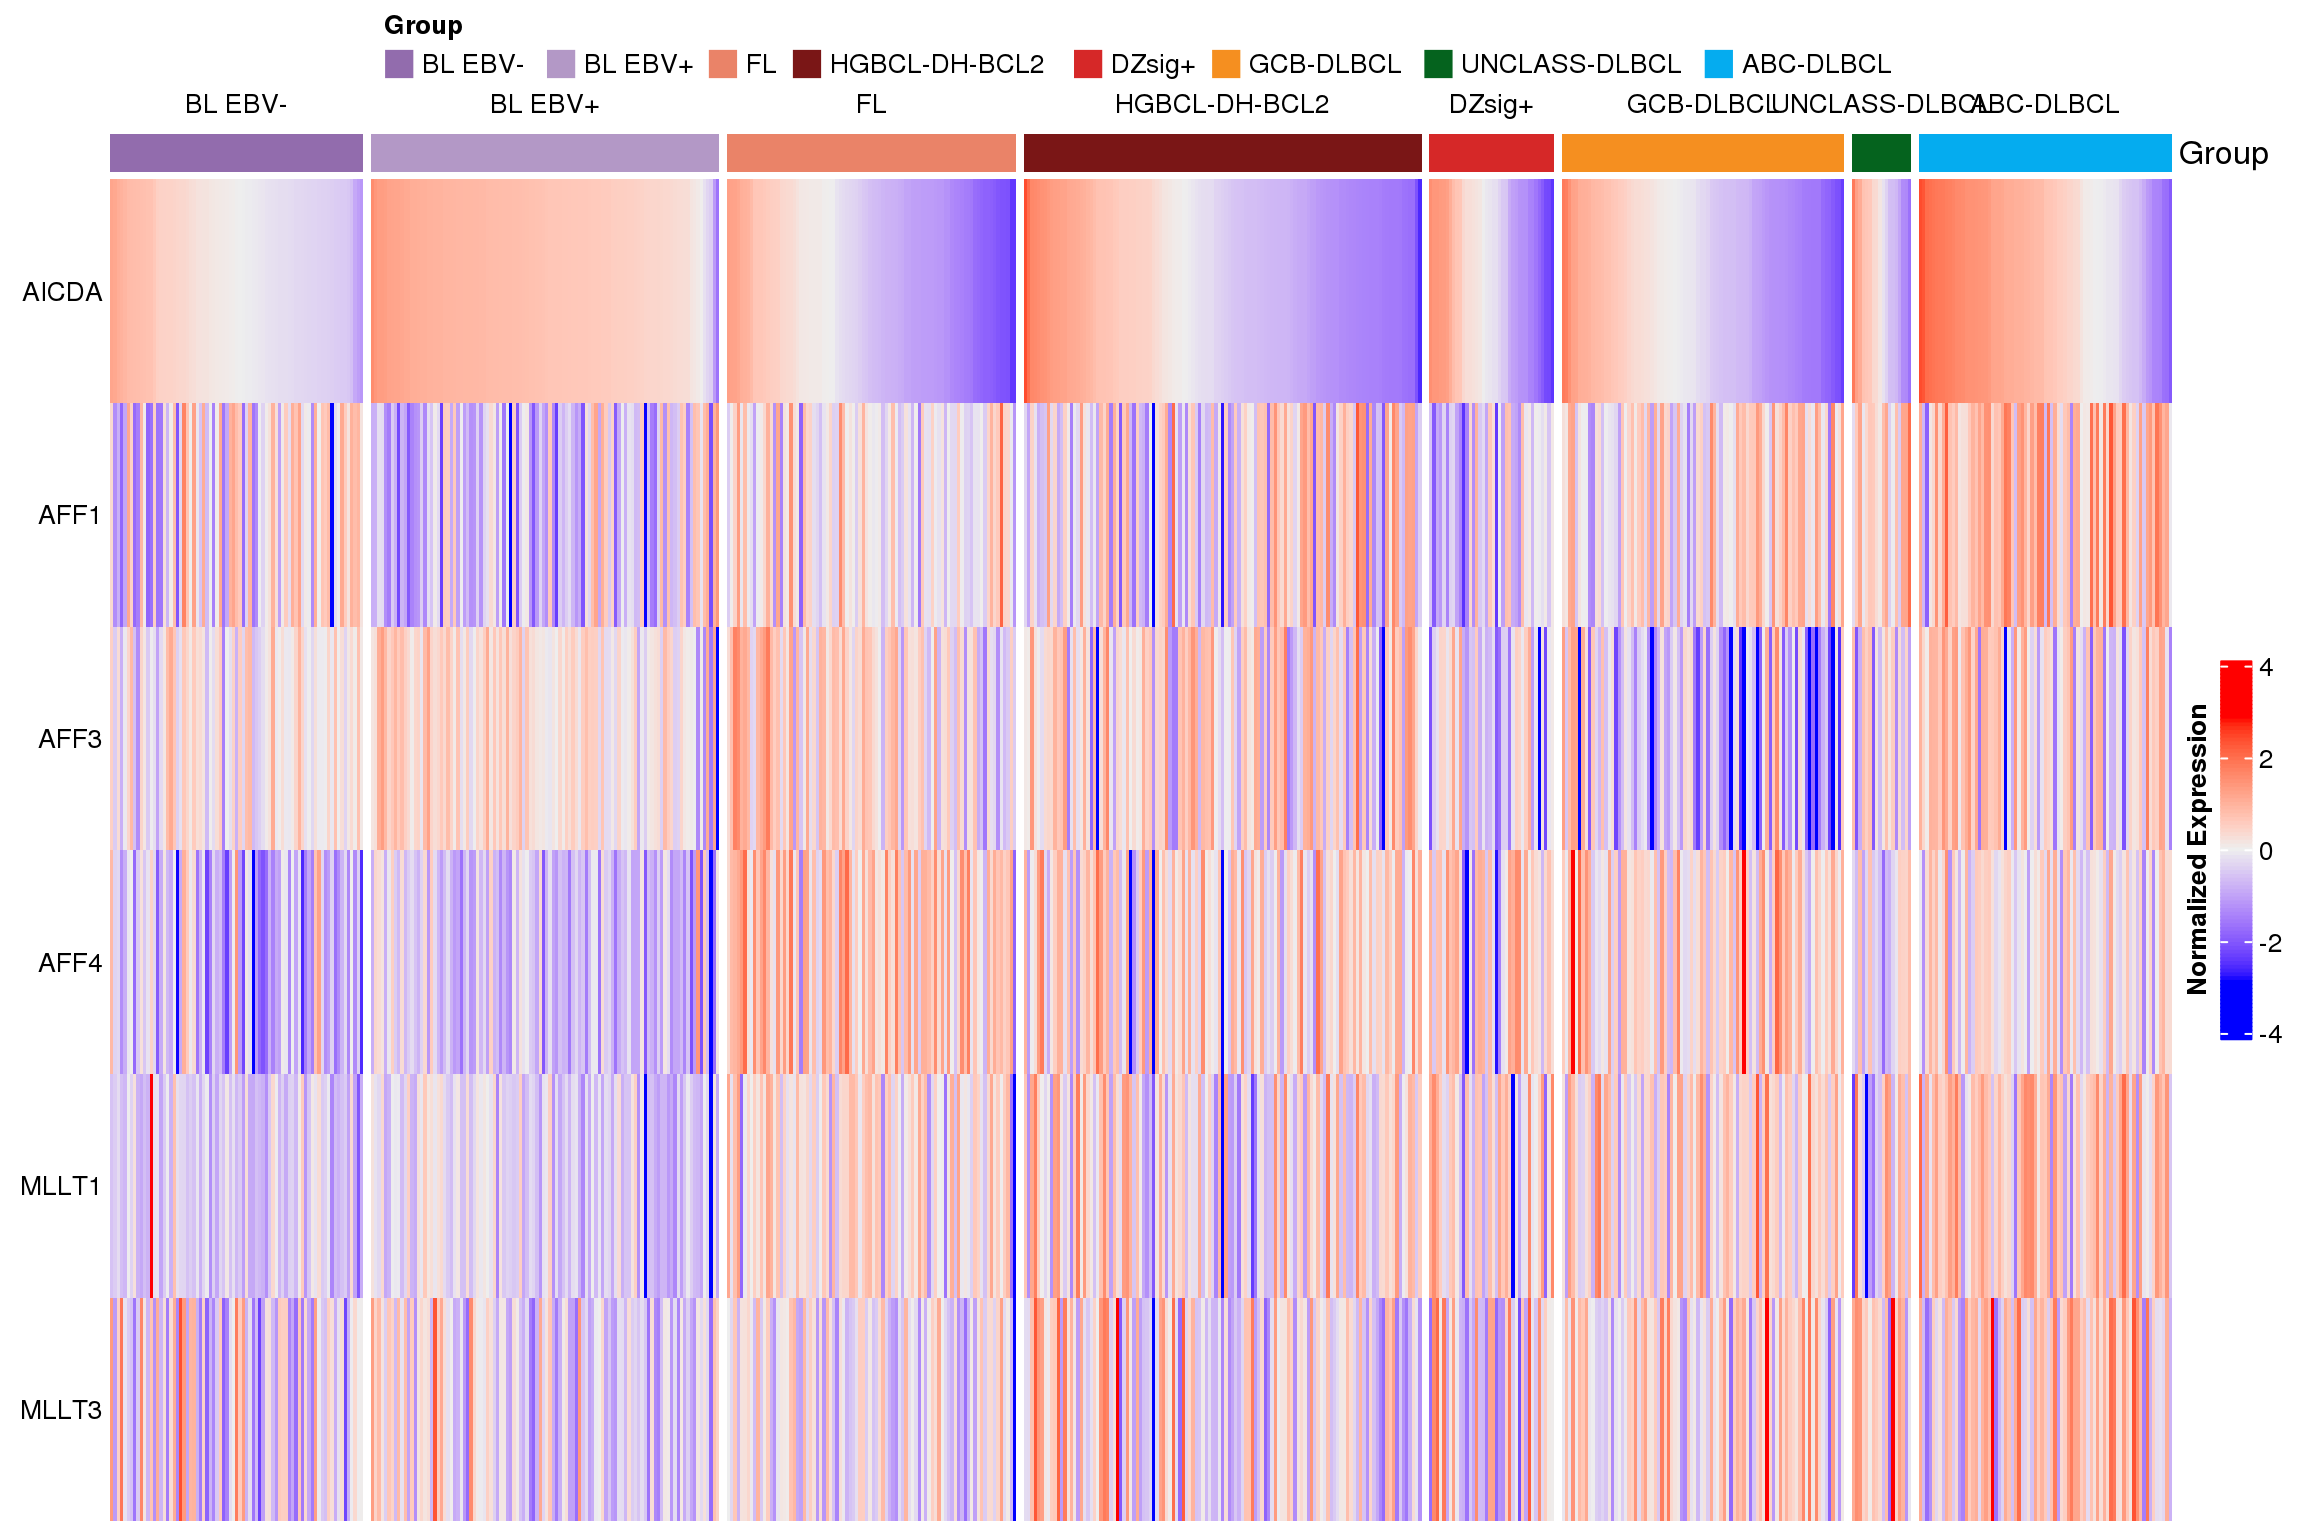
Figure 3 shows the expression of each gene across lymphoma entities.
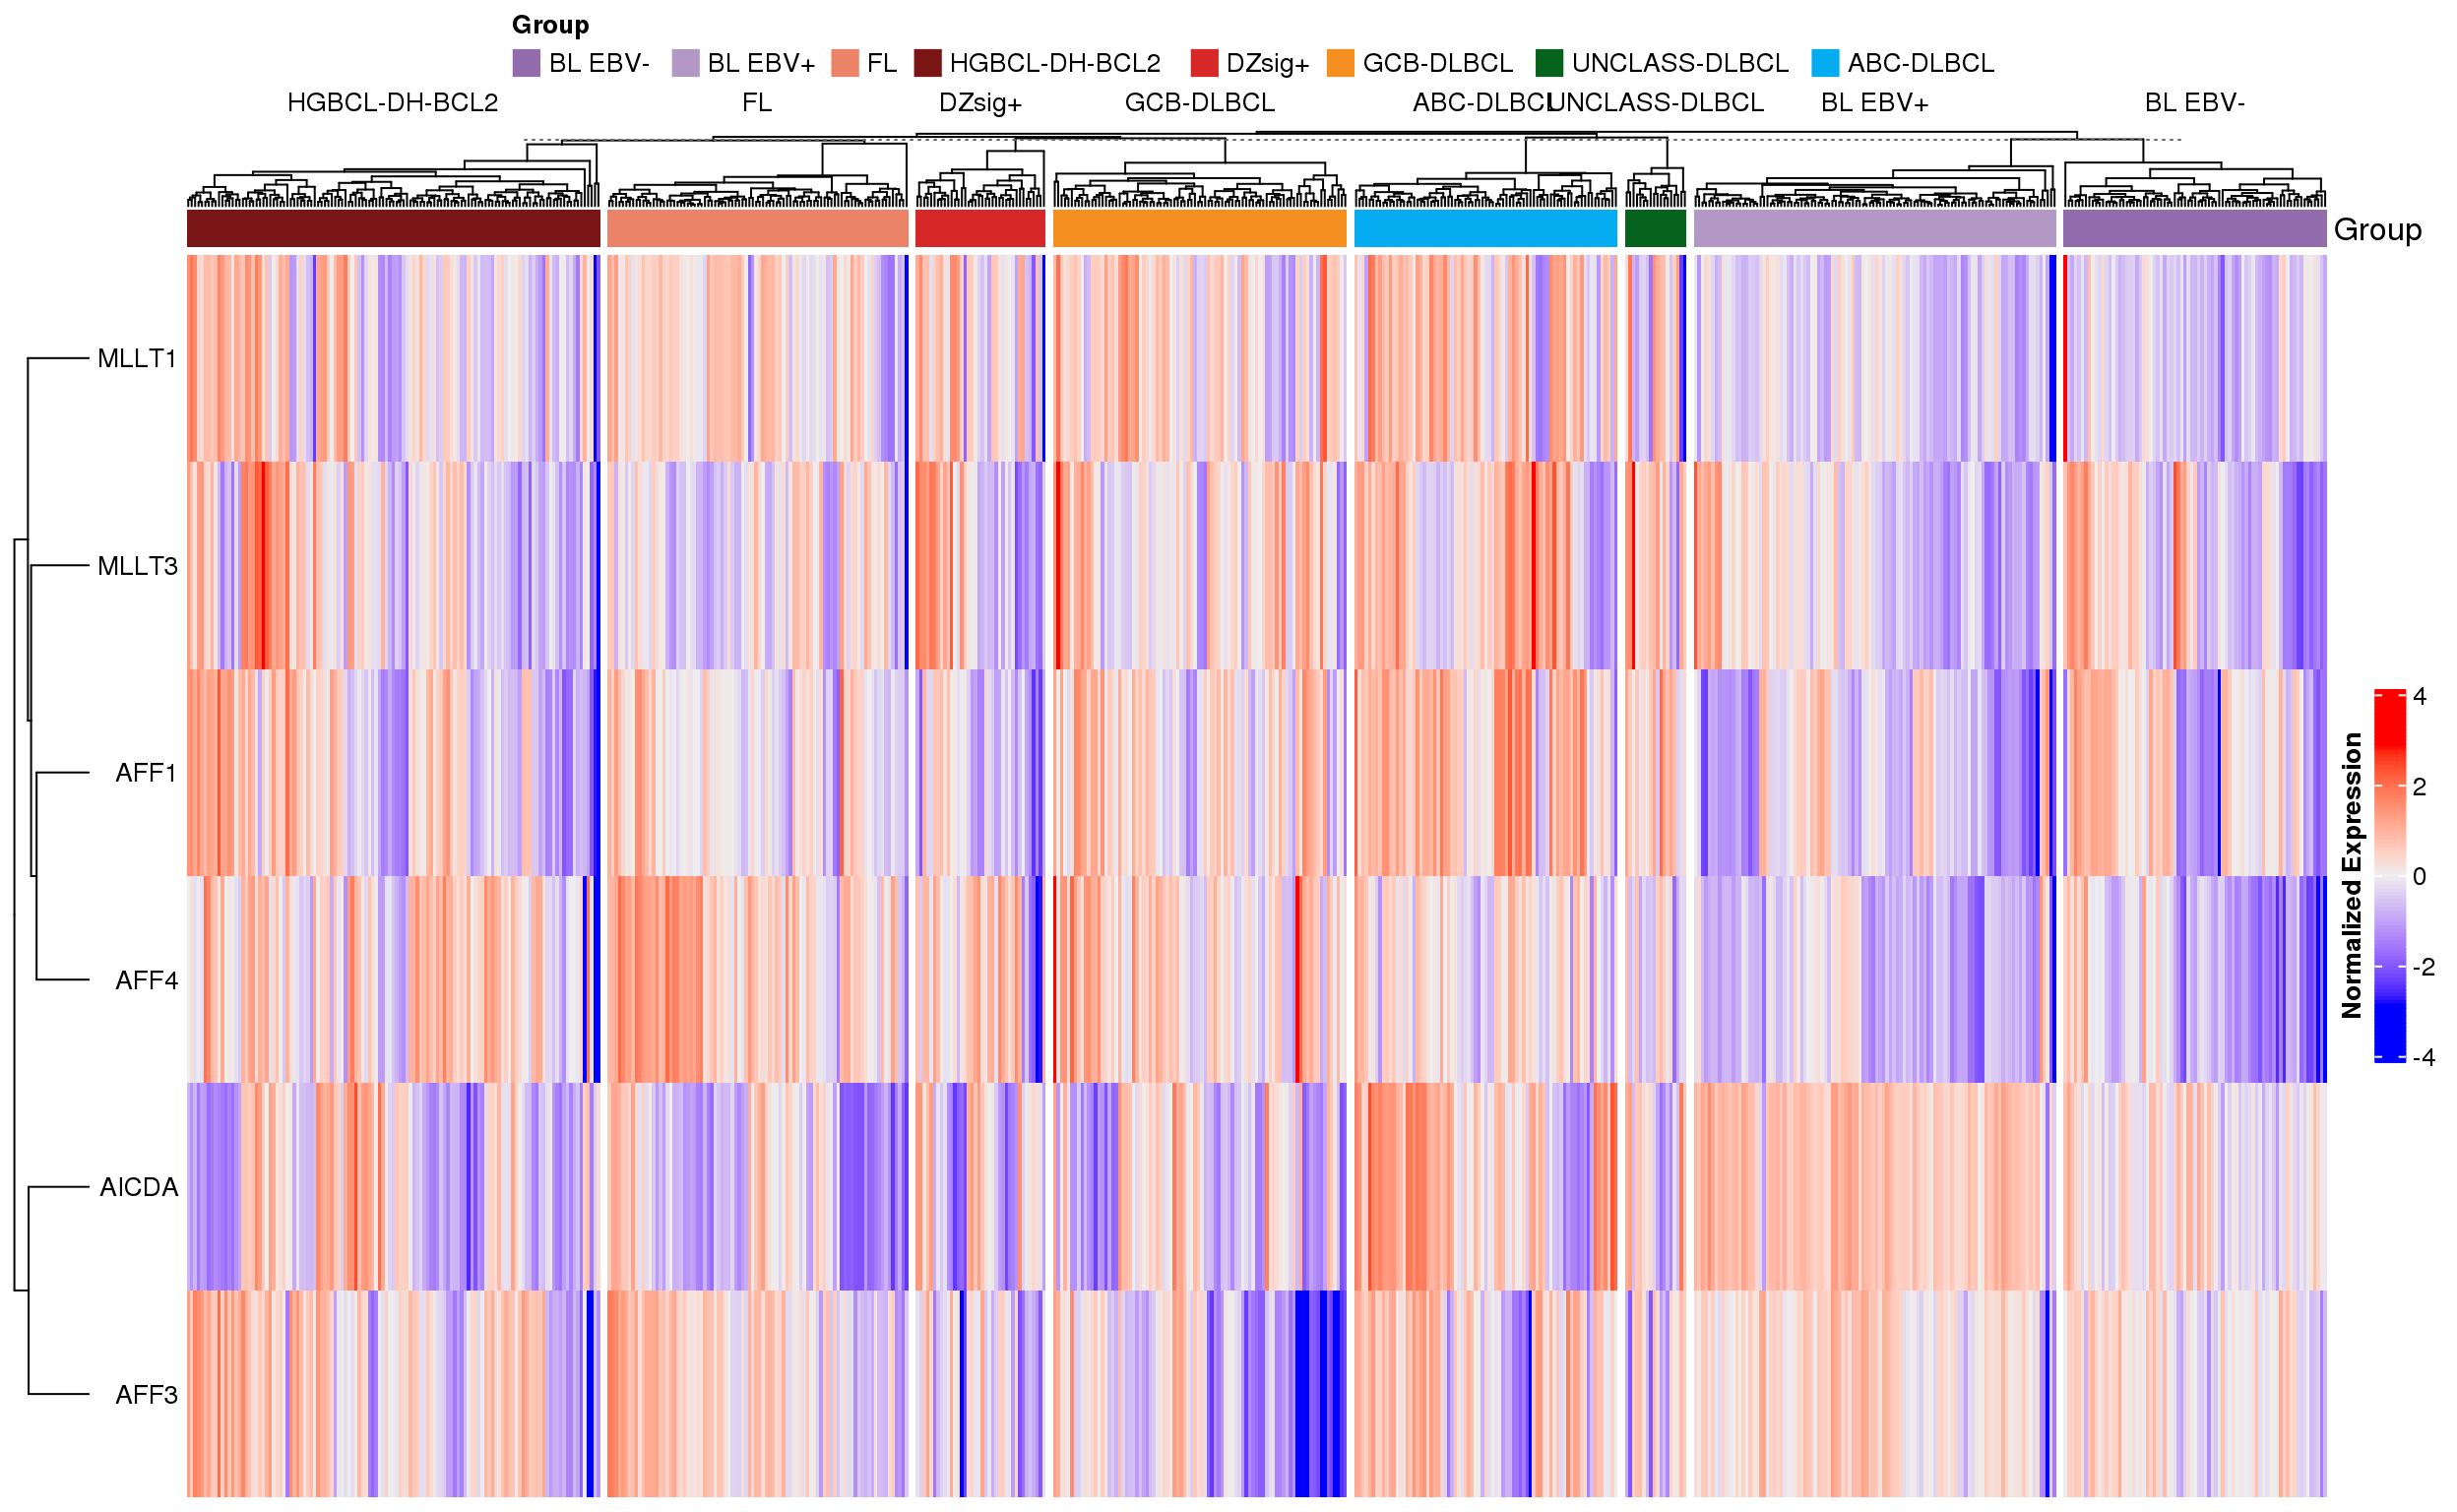
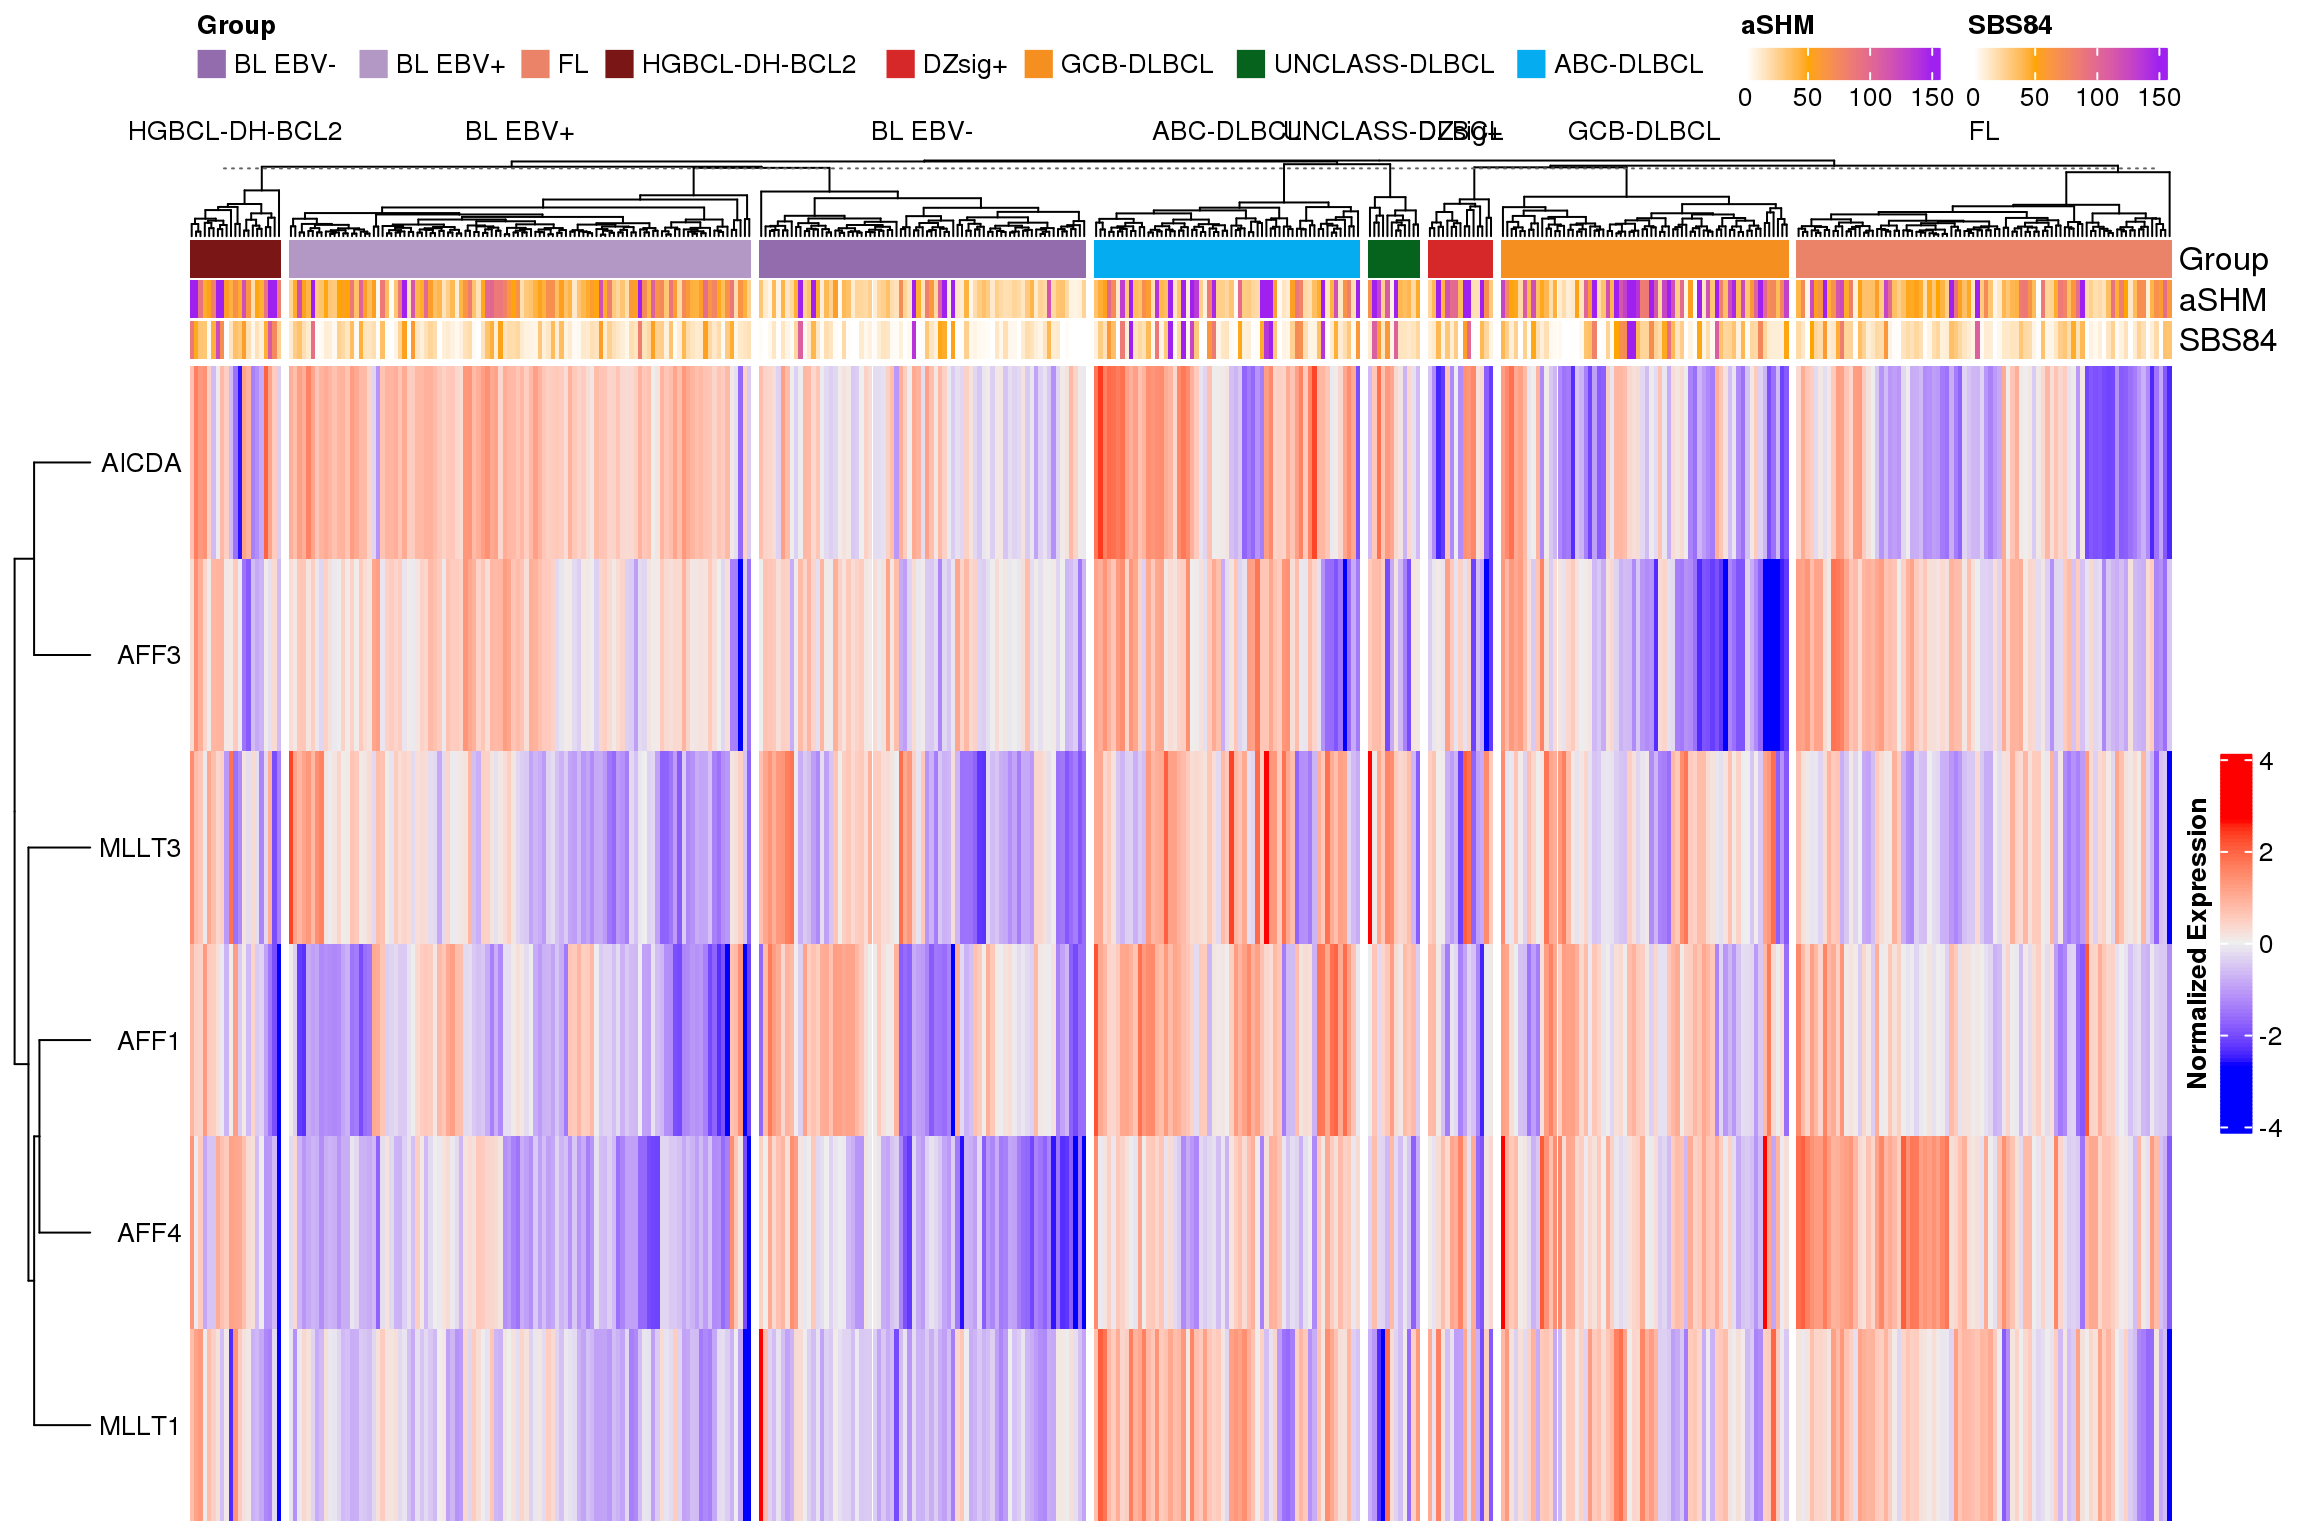
The next version of the heatmap (Figure 4) is clustered. This version emphasizes the heterogeneity of expression across and within different lymphoma types.
Correlate expression with aSHM and SBS84
Next, we will try to layer on aSHM information for these tumours. For this, I’ll obtain SSM status for mutations across aSHM space and layer on mutation signatures using SigMiner. This reduces the number of samples shown on the heatmap because not all samples with RNAseq also have WGS. aSHM regions are defined here. Then, SigMiner will be run to quantify exposure to SBS84 across aSHM space specifically.
The ordered heatmap (Figure 5) does not reveal any major patterns of association between expression of SEC genes and levels of aSHM or SBS84 exposure.
The clustered heatmap (Figure 6) suggests perhaps some association between levels of MLLT1 and amount of aSHM in GCB-DLBCL and HGBCL-DH-BCL2. Let’s explore that further with a correlation plot.
There aren’t any clear linear correlations between the expression of each SEC gene and either total SBS84 (Figure 7) or total aSHM mutation load (Figure 8). However, it’s possible that the combination of MLLT3 with AICDA is required to achieve high aSHM. For this, we will bin tumours into combinations of MLLT3 high/low and AICDA high/low. We will set the median expression for each gene within each group to acknowledge the range of expression values across groups.
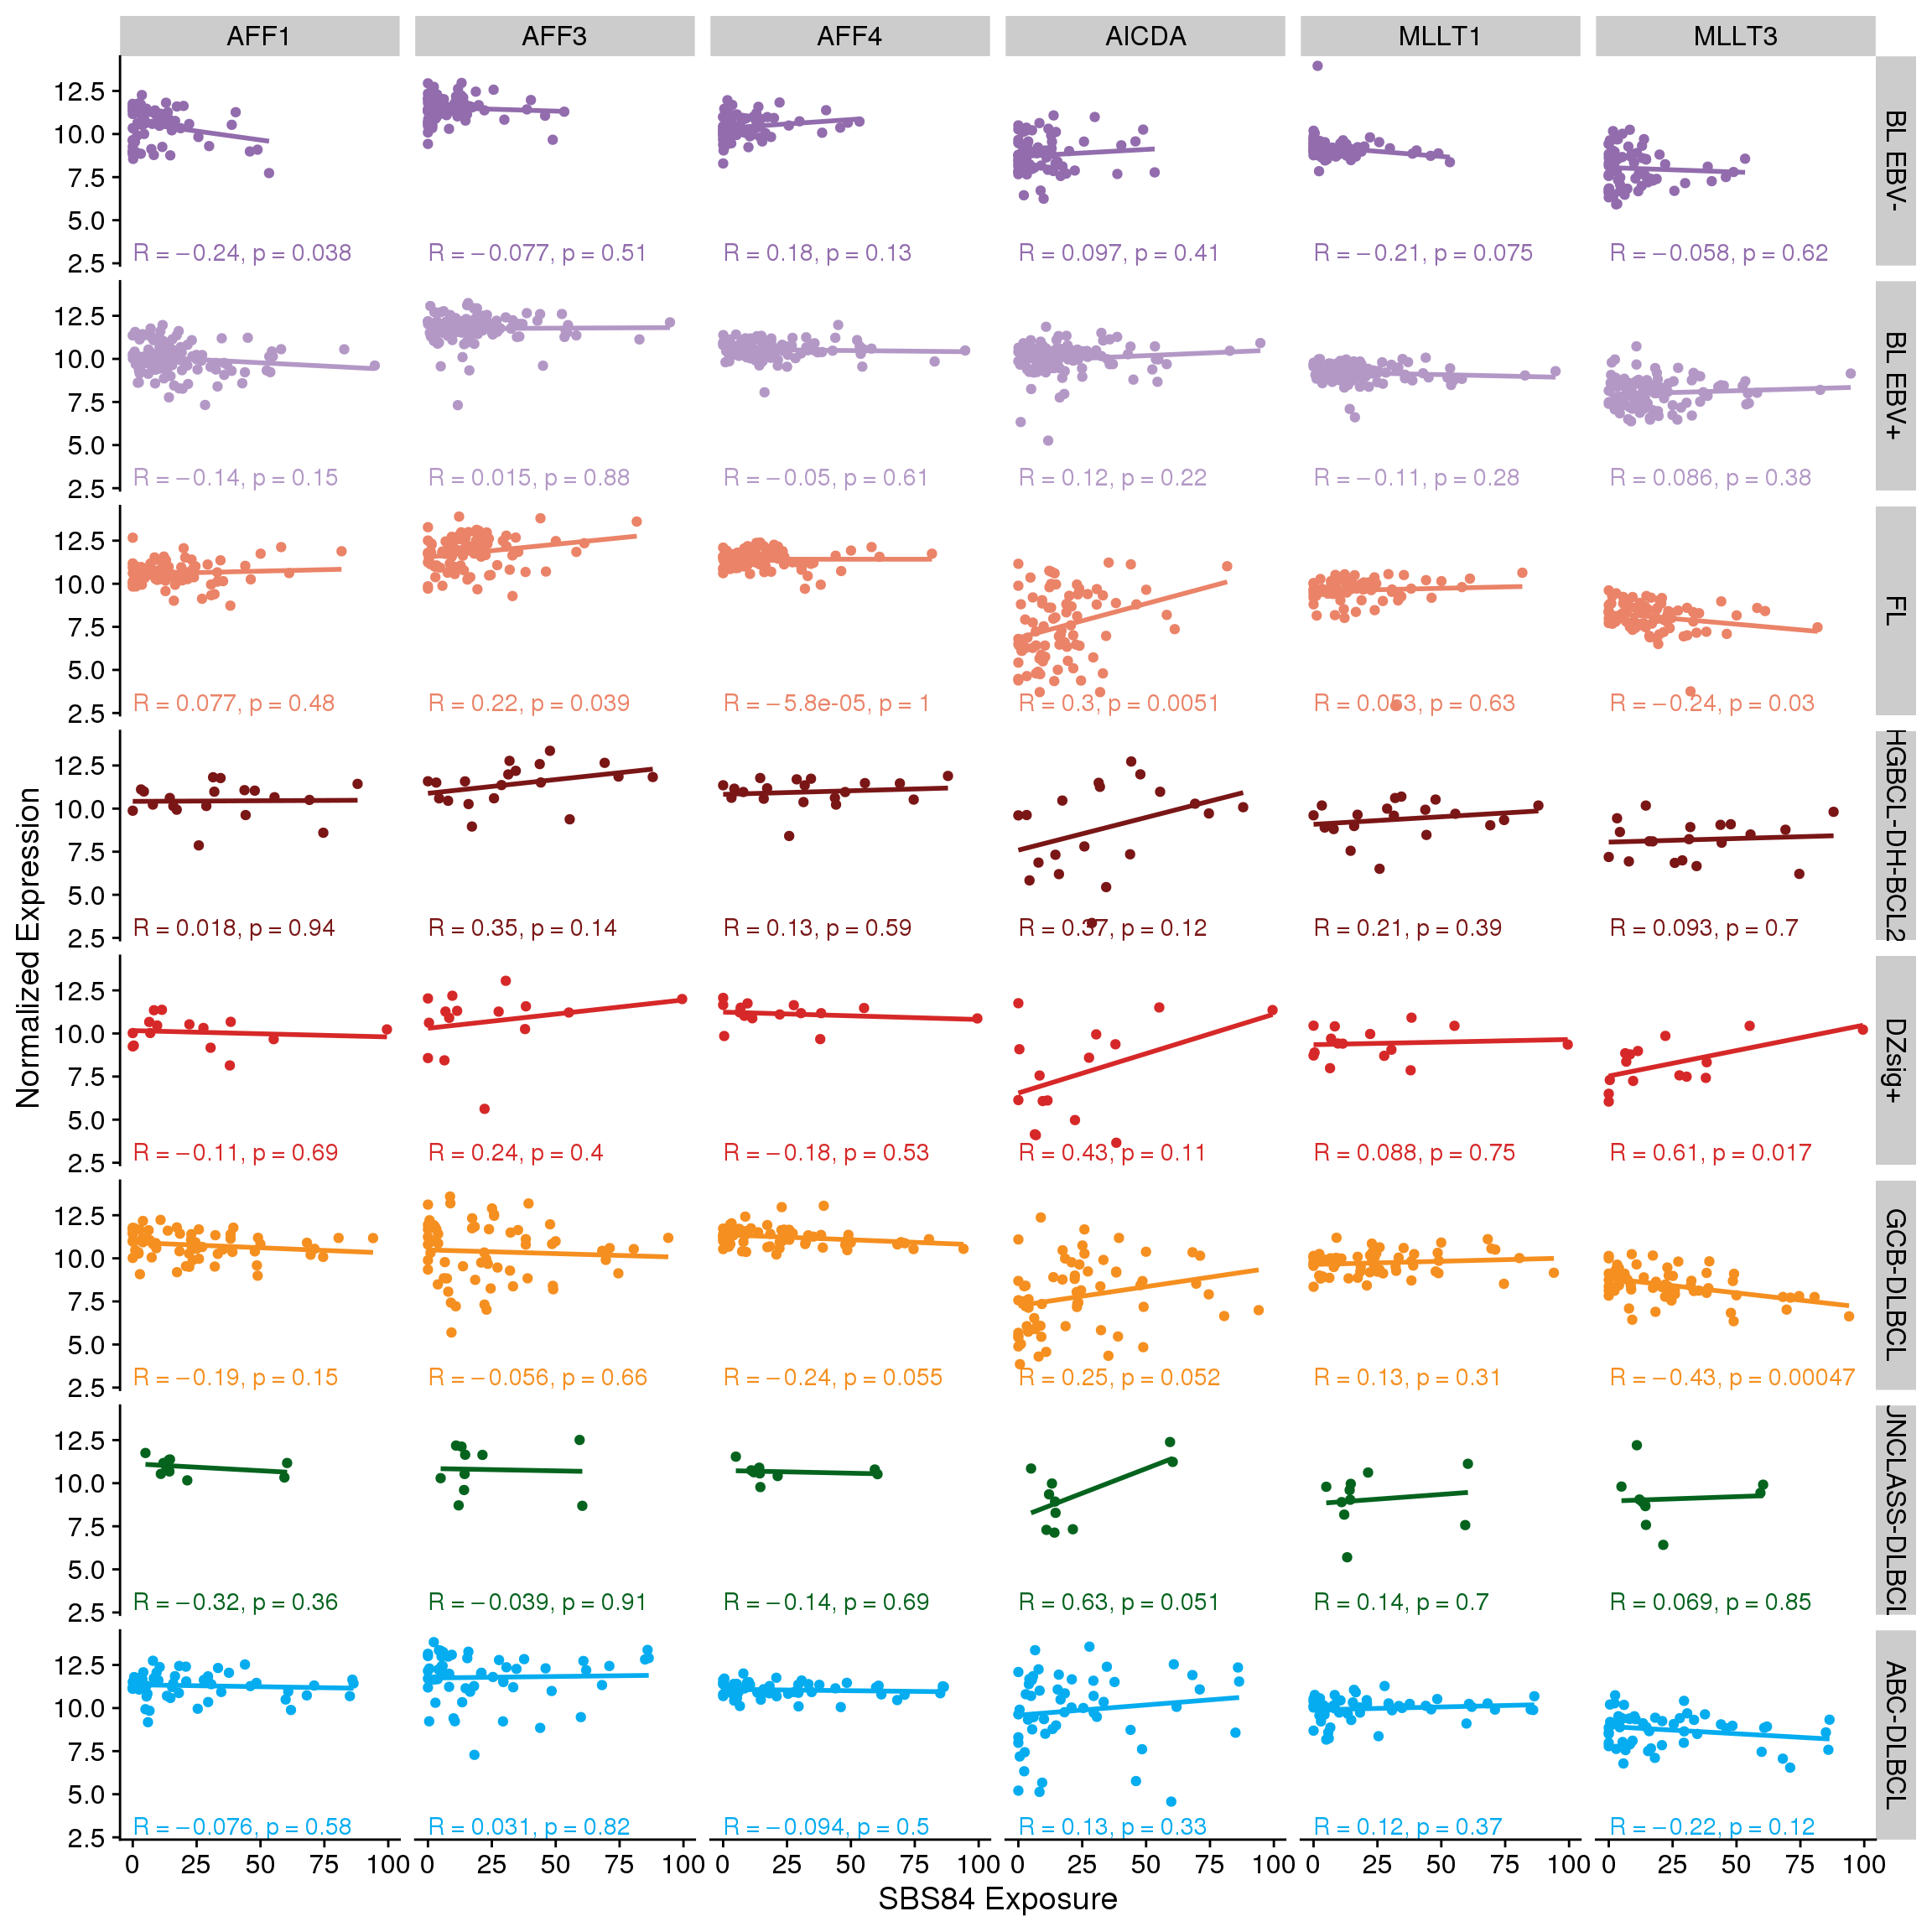
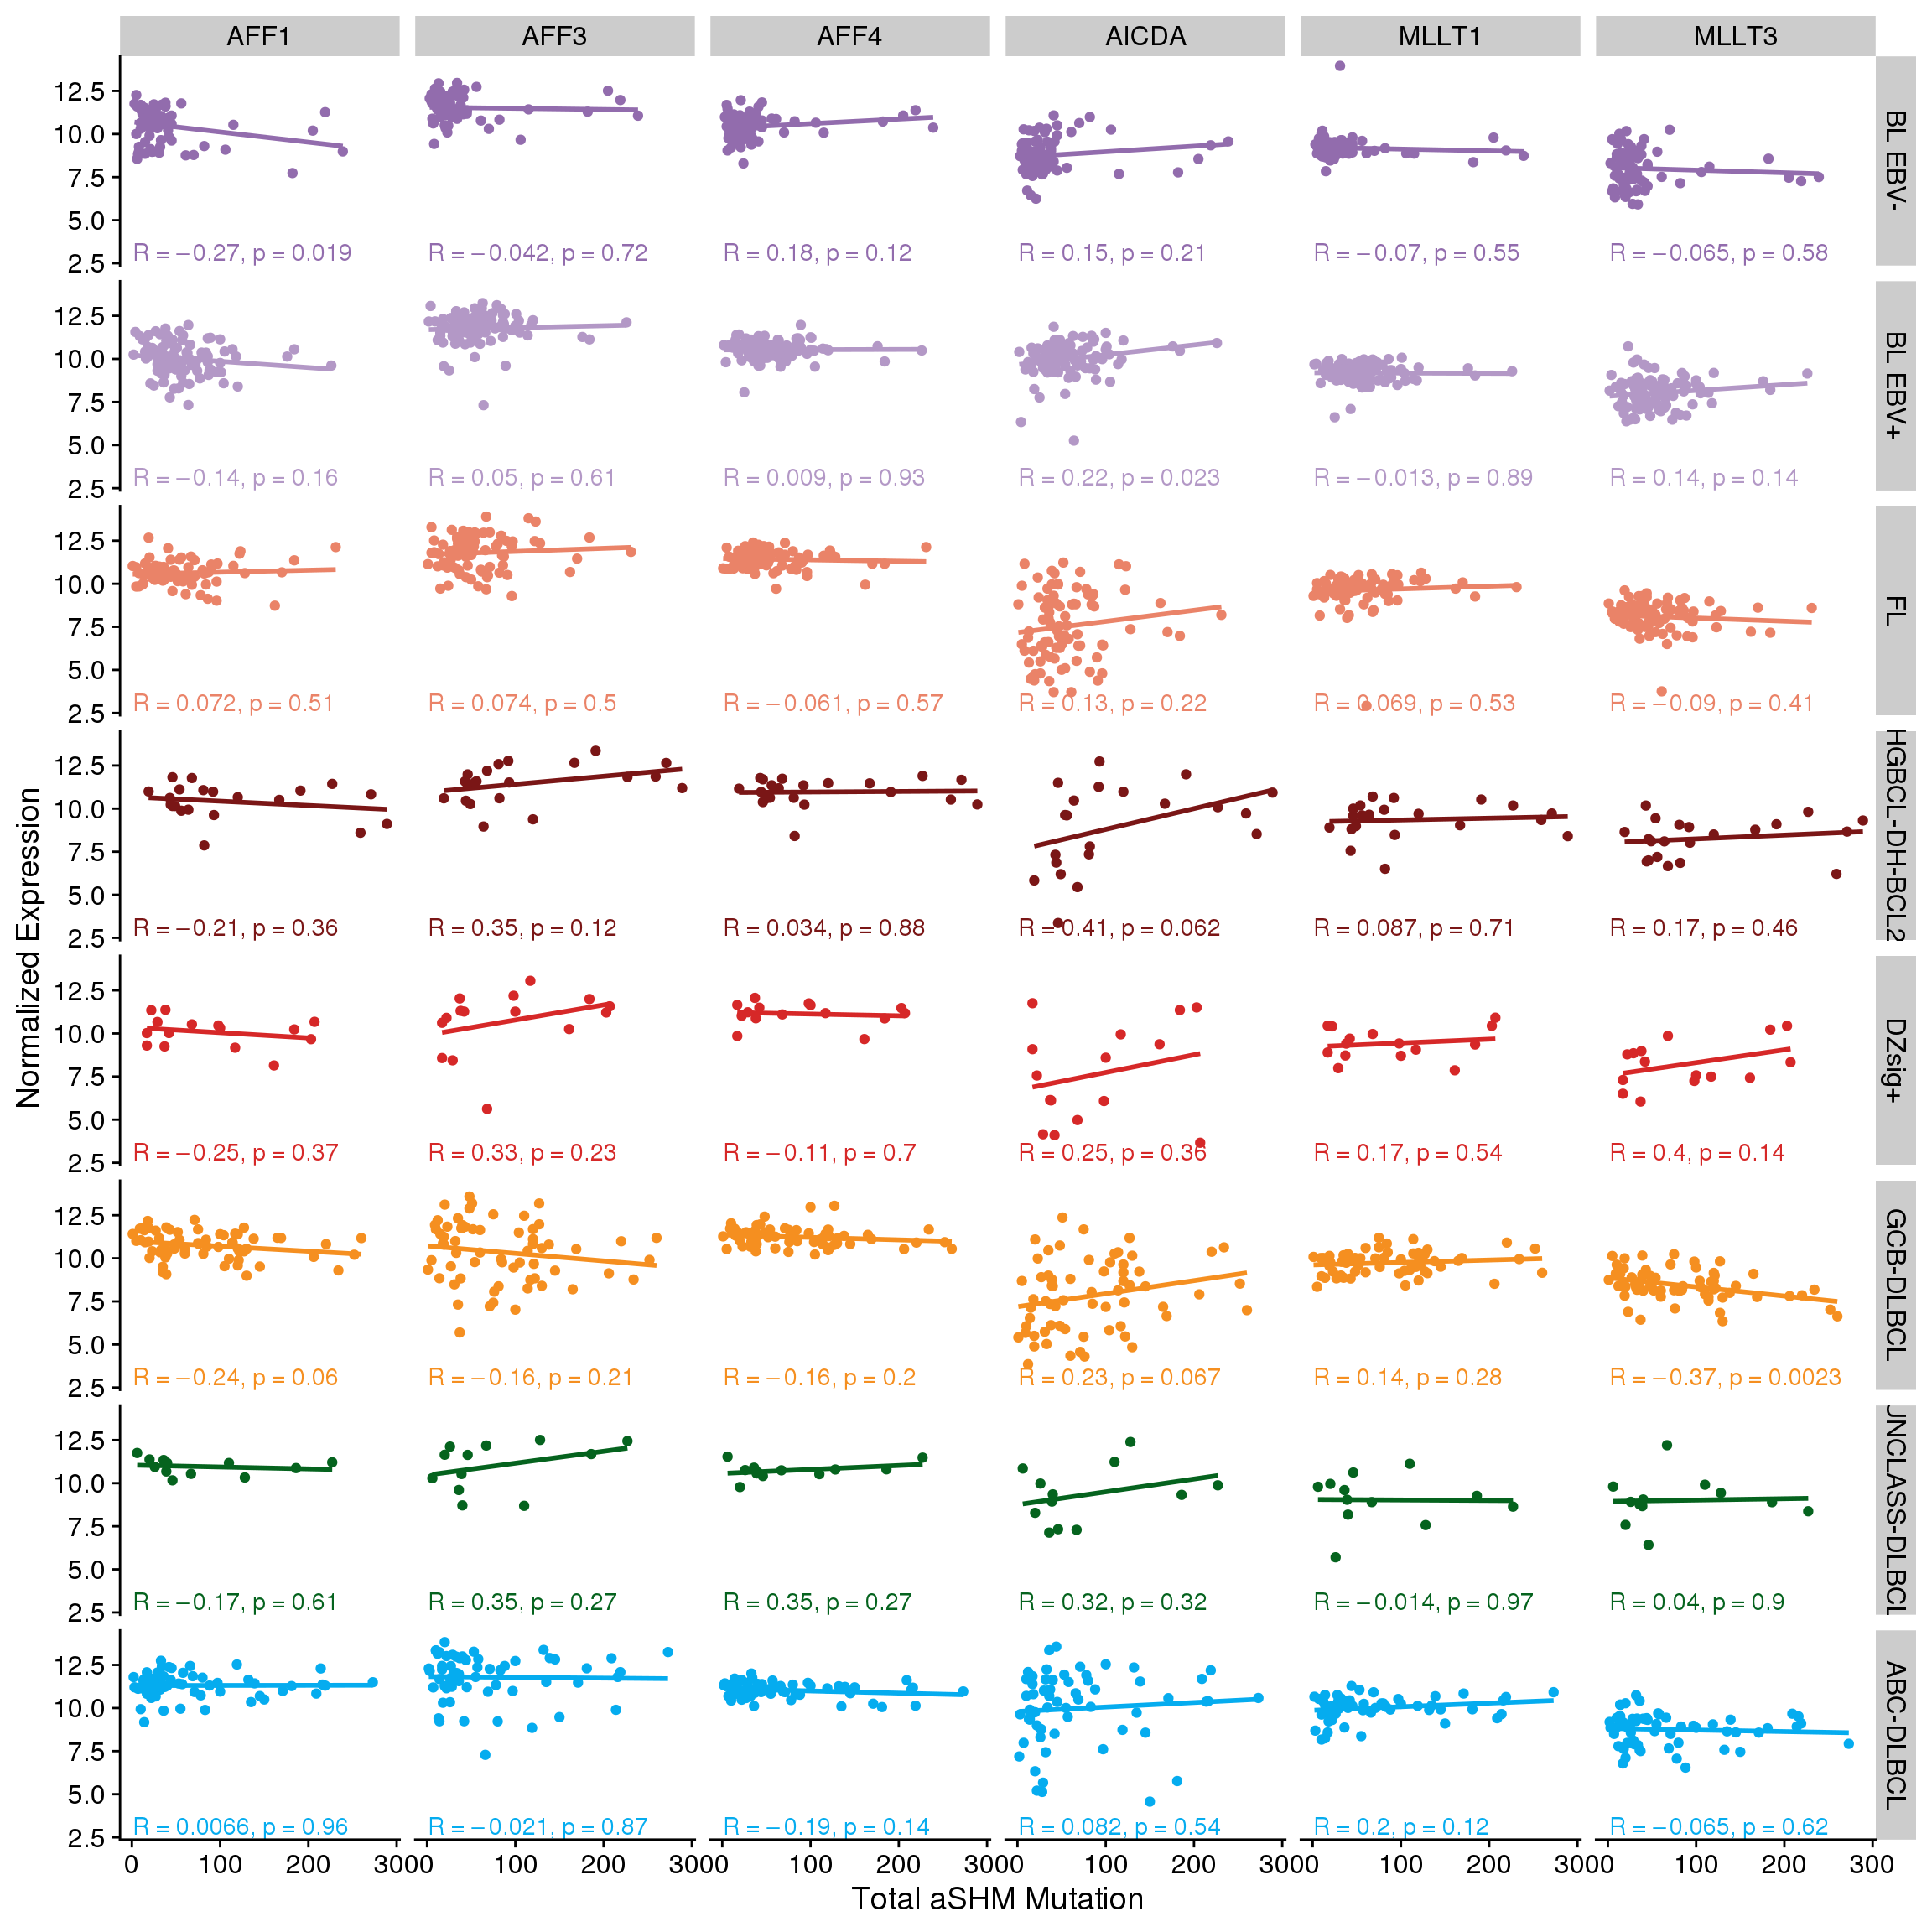
There is no significant association between either SBS84 exposure (Figure 9) and AICDA/MLLT3 expression or total aSHM mutations (Figure 10); however, there is a pattern in HGBCL-DH-BCL2, DZSig+, and ABC-DLBCL where the cases with the highest aSHM/SBS84 burden are in the group with high AICDA and MLLT3 expression. Let’s explore this further with a linear model.
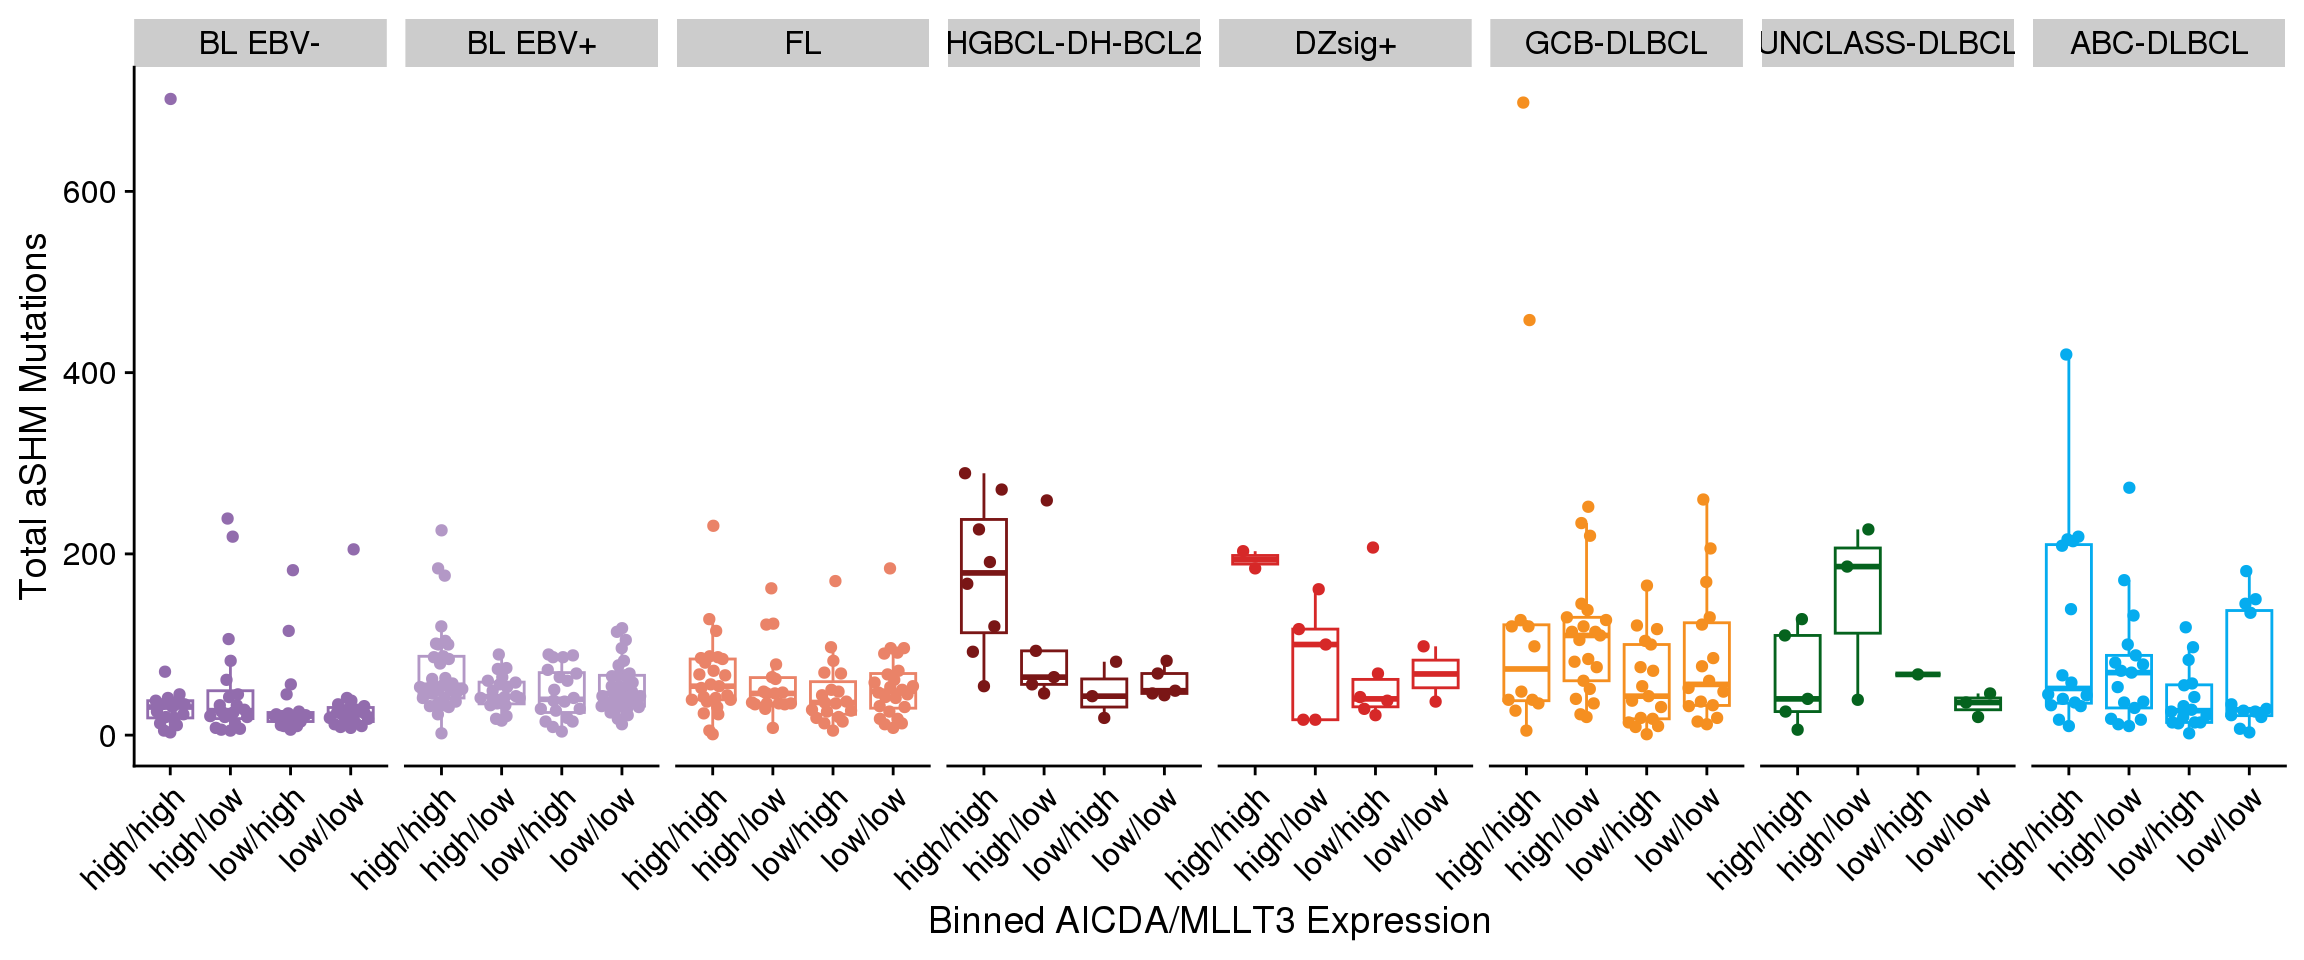
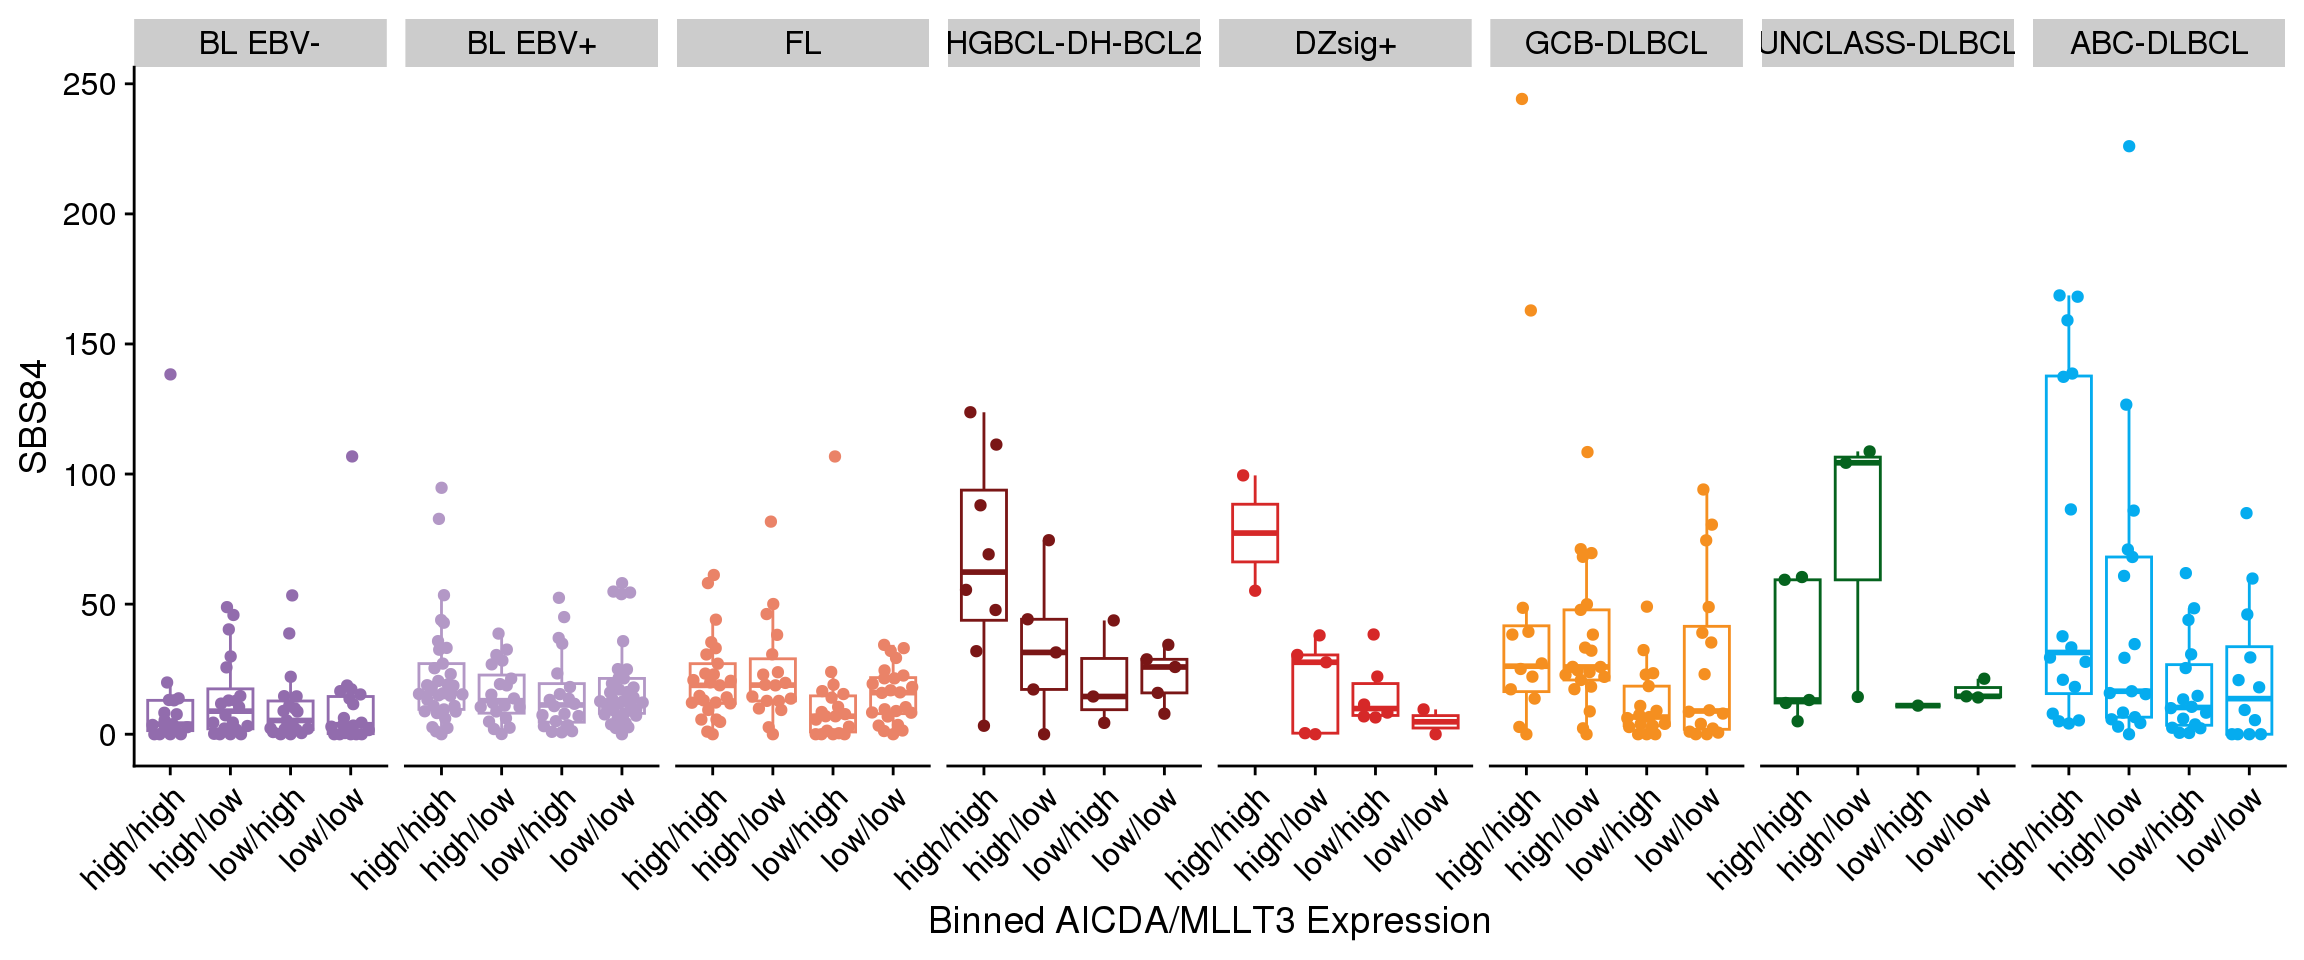
Table 2 shows an association between AICDA expression and aSHM independent of lymphoma type, while there is no significant association with either MLLT1 or MLLT3. A similar pattern appears for SBS84 (Table 3).
| term | estimate | std.error | statistic | p.value |
|---|---|---|---|---|
| (Intercept) | -51.6067697 | 50.198456 | -1.0280549 | 0.3045006 |
| groupBL EBV+ | 0.3839771 | 10.994614 | 0.0349241 | 0.9721564 |
| groupFL | 19.2704959 | 11.743885 | 1.6408962 | 0.1015485 |
| groupHGBCL-DH-BCL2 | 64.5018837 | 17.603054 | 3.6642440 | 0.0002790 |
| groupDZsig+ | 51.9621885 | 20.315256 | 2.5577915 | 0.0108751 |
| groupGCB-DLBCL | 57.4567878 | 12.523668 | 4.5878562 | 0.0000059 |
| groupUNCLASS-DLBCL | 26.2380850 | 22.451985 | 1.1686310 | 0.2431983 |
| groupABC-DLBCL | 15.4213023 | 13.152632 | 1.1724880 | 0.2416489 |
| AICDA | 8.0470718 | 1.991384 | 4.0409447 | 0.0000630 |
| MLLT3 | 1.2531529 | 3.600128 | 0.3480856 | 0.7279458 |
| MLLT1 | 1.8362049 | 4.590965 | 0.3999606 | 0.6893837 |
| term | estimate | std.error | statistic | p.value |
|---|---|---|---|---|
| (Intercept) | -28.5407284 | 20.9840244 | -1.3601170 | 0.1745039 |
| groupBL EBV+ | 1.3845815 | 4.5959829 | 0.3012591 | 0.7633622 |
| groupFL | 10.3497228 | 4.9091941 | 2.1082326 | 0.0355875 |
| groupHGBCL-DH-BCL2 | 28.5578706 | 7.3584516 | 3.8809620 | 0.0001203 |
| groupDZsig+ | 15.7893725 | 8.4922100 | 1.8592772 | 0.0636691 |
| groupGCB-DLBCL | 21.3389741 | 5.2351601 | 4.0760882 | 0.0000545 |
| groupUNCLASS-DLBCL | 22.8361220 | 9.3854083 | 2.4331517 | 0.0153737 |
| groupABC-DLBCL | 21.4196413 | 5.4980804 | 3.8958399 | 0.0001134 |
| AICDA | 4.0282254 | 0.8324409 | 4.8390529 | 0.0000018 |
| MLLT3 | -0.6924579 | 1.5049304 | -0.4601262 | 0.6456577 |
| MLLT1 | 1.2043276 | 1.9191211 | 0.6275412 | 0.5306369 |
Conclusions
These analyses confirm an overall association between AICDA expression and levels of aSHM and SBS84 exposure. However, meaningful correlations with MLLT1 and MLLT3 expression were not identified. Further analyses of loci bound by these histone readers, as identified by ChIP-seq, may further be used to tease apart subtype-specific patterns of aSHM driven by these proteins.