Genome-wide discovery of somatic coding and non-coding mutations in pediatric endemic and sporadic Burkitt lymphoma
Bruno M. Grande☯, Daniela S. Gerhard☯, Nicholas B. Griner, Aixiang Jiang, Eric Y. Zhao, Luka Culibrk, Nicole Knoetze, Jeremy S. Abramson, Thomas Alexander, Hilary Allen, Jeffrey Bethony, Jay Bowen, Corey Casper, John Kim Choi, Tanja M. Davidsen, Maureen Dyer, Julie M. Gastier-Foster, Patee Gesuwan, Timothy C. Greiner, Thomas G. Gross, Nancy Lee Harris, Yiwen He, John D. Irvin, Elaine S. Jaffe, Steven J. Jones, Jean Paul Martin, Marie-Reine Martin, Sam M. Mbulaiteye, Charles G. Mullighan, Andrew J. Mungall, Constance Namirembe, Karen Novik, Ariela Noy, Abraham Omoding, Jackson Orem, John T. Sandlund, Roland Schmitz, Wyndham H. Wilson, Yussanne Ma, Marco A. Marra, Ryan D. Morin☯, Louis M. Staudt☯
☯ These authors have contributed equally.
Abstract
Burkitt lymphoma (BL) is an aggressive B-cell non-Hodgkin lymphoma that may be curable for sporadic pediatric cases in high-resource countries, but it remains a deadly disease for endemic cases in equatorial Africa and older sporadic cases. A number of genomic studies have focused on BL, but many questions remained out of reach due to limited samples sizes and/or lack of multi-dimensional molecular data, such as the elusive role of the Epstein–Barr virus (EBV). We have assembled an unprecedented large and diverse BL cohort consisting of 74 endemic and 17 sporadic pediatric cases, and performed whole genome, RNA, and microRNA sequencing on the tumor samples. We also re-analyzed genomic data from 17 sporadic pediatric BL cases included in the ICGC MMML-Seq project. Through an integrative analysis of this dataset, we describe the genome-wide landscape of somatic coding and non-coding mutations in BL. We uncover genes as being significantly mutated in BL for the first time, namely SIN3A, HIST1H1E, CHD8, USP7, and RFX7. We also identify sources of molecular heterogeneity, including differences in AID-mediated somatic hypermutation (SHM), germinal center cell-of-origin, and genome-wide and gene-wise mutation rates. Notably, we report 5 genes or gene modules that are significantly differentially mutated based on EBV infection status, none of which are differentially mutated according to clinical variant status or EBV genome type.
The data presented here not only advances our understanding of BL biology through the identification of novel recurrently mutated genes, but it demonstrates that EBV infection status is a more meaningful classification criterion, resulting in more genetically distinct subtypes.
Introduction
Burkitt lymphoma (BL) is an aggressive B-cell non-Hodgkin lymphoma. In high-resource countries, it is considered rare and curable in children, but it remains a deadly disease as the most common pediatric cancer in equatorial Africa1. Survival is poor among African children with BL due to late stage at presentation and limitations in the ability to support intensive chemotherapeutic regimens necessary to induce durable remissions2. Genetically, it features a hallmark chromosomal rearrangement that juxtaposes the MYC proto-oncogene in proximity to an immunoglobulin heavy (IGH)or light chain (IGK/IGL) enhancer3,4. The uneven geographic distribution of BL in Africa has prompted investigation into etiological agents such as viruses and parasites1,5. Cases arising in malaria-endemic regions, where the disease is most common, constitute the clinical variant known as endemic BL (eBL). In addition to an association with malaria, virtually every eBL case is infected by the Epstein–Barr virus (EBV), a ubiquitous virus that infects 90% of the global adult population6. Given EBV’s potent ability of transforming B cells in vitro7, researchers have long speculated on its oncogenic role in BL formation, but many questions remain unanswered. Notably, little is known about what distinguishes BL-associated EBV from strains that infect healthy individuals who do not develop lymphoma. Some have suggested a hit-and-run mechanism whereby EBV would infect B cells, induce durable epigenetic changes, and then switch to a latent state8. However, this hypothesis must be reconciled with the fact that EBV persists in BL cells despite spontaneous episome loss in dividing cells9. One can only presume that EBV still provides some selective advantage to infected B cells, which outcompete cells that lose the virus. EBV must achieve this effect with little to no protein expression—with the exception of EBNA1—to avoid detection by the immune system. Addressing these questions must start by improving our understanding of the biological differences associated with or induced by EBV in BL.
The second clinical variant, sporadic BL (sBL), has a much lower incidence and is restricted to regions outside of malaria-endemic areas, e.g. North America and Europe10,11. EBV infection rates are markedly lower among sBL cases at around 10-20%12. Given the extreme rate of cellular proliferation in BL, tumors tend to dramatically respond to intensive albeit toxic chemotherapy13. In the presence of proper supportive care, cure rates in children with sBL are often above 90%13. However, treating adult and elderly patients remains a significant challenge, with overall survival rates being as low as 30% to 60%13. This major difference in response to therapy is often attributed to the reduced ability of older patients of coping with intensive treatment regimens14. Poor survival rates also apply to the third clinical variant, immunodeficiency-related BL, which is mostly caused by HIV infection15–17. Thus, the need for an improved molecular understanding of this disease is true even for countries with the resources to administer standard therapy and manage its toxicity. A number of genomic studies have advanced our understanding of BL, but many questions remained out of reach due to limited samples sizes and/or lack of multi-dimensional molecular data18–22. The Burkitt Lymphoma Genome Sequencing Project (BLGSP) is well-positioned to conduct an integrative molecular characterization of a large comprehensive BL cohort including an unprecedented representation of endemic cases. In this first landmark BLGSP study, we focus on the genome-wide discovery of somatic coding and non-coding mutations in 108 pediatric BL cases. We hypothesized on the existence of biological differences between BL subtypes and suspected that EBV infection status would result in more significant contrast than clinical variant status. Through this work, we have identified sources of molecular heterogeneity in BL, including differences in AID-mediated somatic hypermutation (SHM), germinal center cell-of-origin, and genome-wide and gene-wise mutation rates. Many of these differences were either greater or exclusively significant according to EBV infection status rather than clinical variant status. The data presented here demonstrates that EBV infection status is a more meaningful classication criterion than the current clinical variant system, resulting in more genetically distinct subtypes.
Results
Clinical and molecular characteristics of the BLGSP pediatric discovery cohort
The BLGSP pediatric discovery cohort consists of 74 endemic BL (eBL) cases from Uganda and 17 sporadic BL (sBL) cases from the United States, amounting to 91 patients in total. Endemic and sporadic EBV infection rates are consistent with previous reports (92% and 18%, respectively) Conversely, our cohort includes 6 EBV-negative eBL cases and 3 EBV-positive sporadic cases, which will assist in attributing biological variation to either clinical variant status or EBV infection status. Tumor samples underwent deep whole genome sequencing (WGS; mean depth 82X; range 55-96), ribo-depleted RNA sequencing (RNA-seq; mean 199M reads; range 132-255M), and microRNA sequencing (miRNA-seq; mean 13M reads; range 2.7-32M). Constitutive DNA was sequenced (mean depth 41X; range 30-51) for all patients to distinguish between somatic and germline mutations. Being the putative cells-of-origin for BL, centroblasts and centrocytes from six pediatric tonsil donors underwent the same RNA-seq and miRNA-seq protocols to act as normal comparators for gene expression analyses. We supplemented certain genomic analyses with re-analyzed WGS data from 17 pediatric sBL cases included in the International Cancer Genome Consortium (ICGC) Molecular Mechanisms in Malignant Lymphoma by Sequencing (MMML-Seq) project19,23. Clinical and molecular characteristics are summarized in Table 1.
| Variable | Level | BLGSP Discovery (n=91) | ICGC MMML-Seq (n=17) | Total (n=108) |
|---|---|---|---|---|
| Clinical variant | Sporadic | 17 (19%) | 17 (100%) | 34 (31%) |
| Endemic | 74 (81%) | 0 (0%) | 74 (69%) | |
| EBV status | Negative | 20 (22%) | 17 (100%) | 37 (34%) |
| Positive | 71 (78%) | 0 (0%) | 71 (66%) | |
| EBV type | Negative | 20 (22%) | 17 (100%) | 37 (34%) |
| Type 1 | 59 (65%) | 0 (0%) | 59 (55%) | |
| Type 2 | 12 (13%) | 0 (0%) | 12 (11%) | |
| Age group (years) | 0 - 5 | 21 (23%) | 6 (35%) | 27 (25%) |
| 6 - 10 | 50 (55%) | 6 (35%) | 56 (52%) | |
| 11 - 15 | 18 (20%) | 3 (18%) | 21 (19%) | |
| 16 - 20 | 2 (2%) | 2 (12%) | 4 (4%) | |
| Tumor biopsy | FF | 85 (93%) | 17 (100%) | 102 (94%) |
| FFPE | 6 (7%) | 0 (0%) | 6 (6%) | |
| MYC translocation | IGH-MYC | 74 (81%) | 13 (76%) | 87 (81%) |
| IGL-MYC | 8 (9%) | 3 (18%) | 11 (10%) | |
| IGK-MYC | 7 (8%) | 1 (6%) | 8 (7%) | |
| BCL6-MYC | 1 (1%) | 0 (0%) | 1 (1%) | |
| IGH-GNA13-MYC | 1 (1%) | 0 (0%) | 1 (1%) |
AID-mediated patterns of non-coding mutations
Unlike previous genomic studies focused on BL, our dataset is sufficiently large to characterize the genome-wide landscape of non-coding mutations. We leveraged the Rainstorm method24 to discern regions enriched in silent mutations. This method located 226 clusters of non-coding mutations with an median size of 175 bp (range 1- 15014 bp). In total, 88 clusters (39%) overlap at least one gene, and the median distance from the nearest transcription start site (TSS) is 2942 bp. If we only consider clusters that are mutated in 10 or more cases, 98 (91%) are within 3000 bp of a TSS (Supplementary Figure 11). The most recurrently mutated clusters are altered in up to 106 cases (98%) and overlap established targets of physiologic (i.e. IGH, IGK, IGL, and MYC) and aberrant (e.g. BCL7A, BCL6, BACH2, TCL1A, and BTG225) somatic hypermutation (SHM; Figure 1). Here, we consider MYC a target of physiologic SHM given its proximity to an immunoglobulin (Ig) locus after the canonical IG-MYC translocation26,27. Altogether, a majority of these clusters can be attributed to AID-mediated SHM given their targets and proximity to the nearest TSS28. Physiologic SHM is observed in nearly all cases, especially at the IGH and MYC loci. On the other hand, signs of aberrant SHM appear to be more prevalent in endemic or EBV-positive cases (Supplementary Figure 12). This is consistent with the observation that AID transcript levels are higher in endemic or EBV-positive tumors (Figure 2) according to the BLGSP RNA-seq data. The fold change in AID expression is slightly higher according to EBV infection status (1.18) than clinical variant status (1.16), hinting that EBV may be modulating AID expression. We confirmed that AID expression is indeed higher in EBV-positive tumors regardless of geographic origin (Supplementary Figure 13).
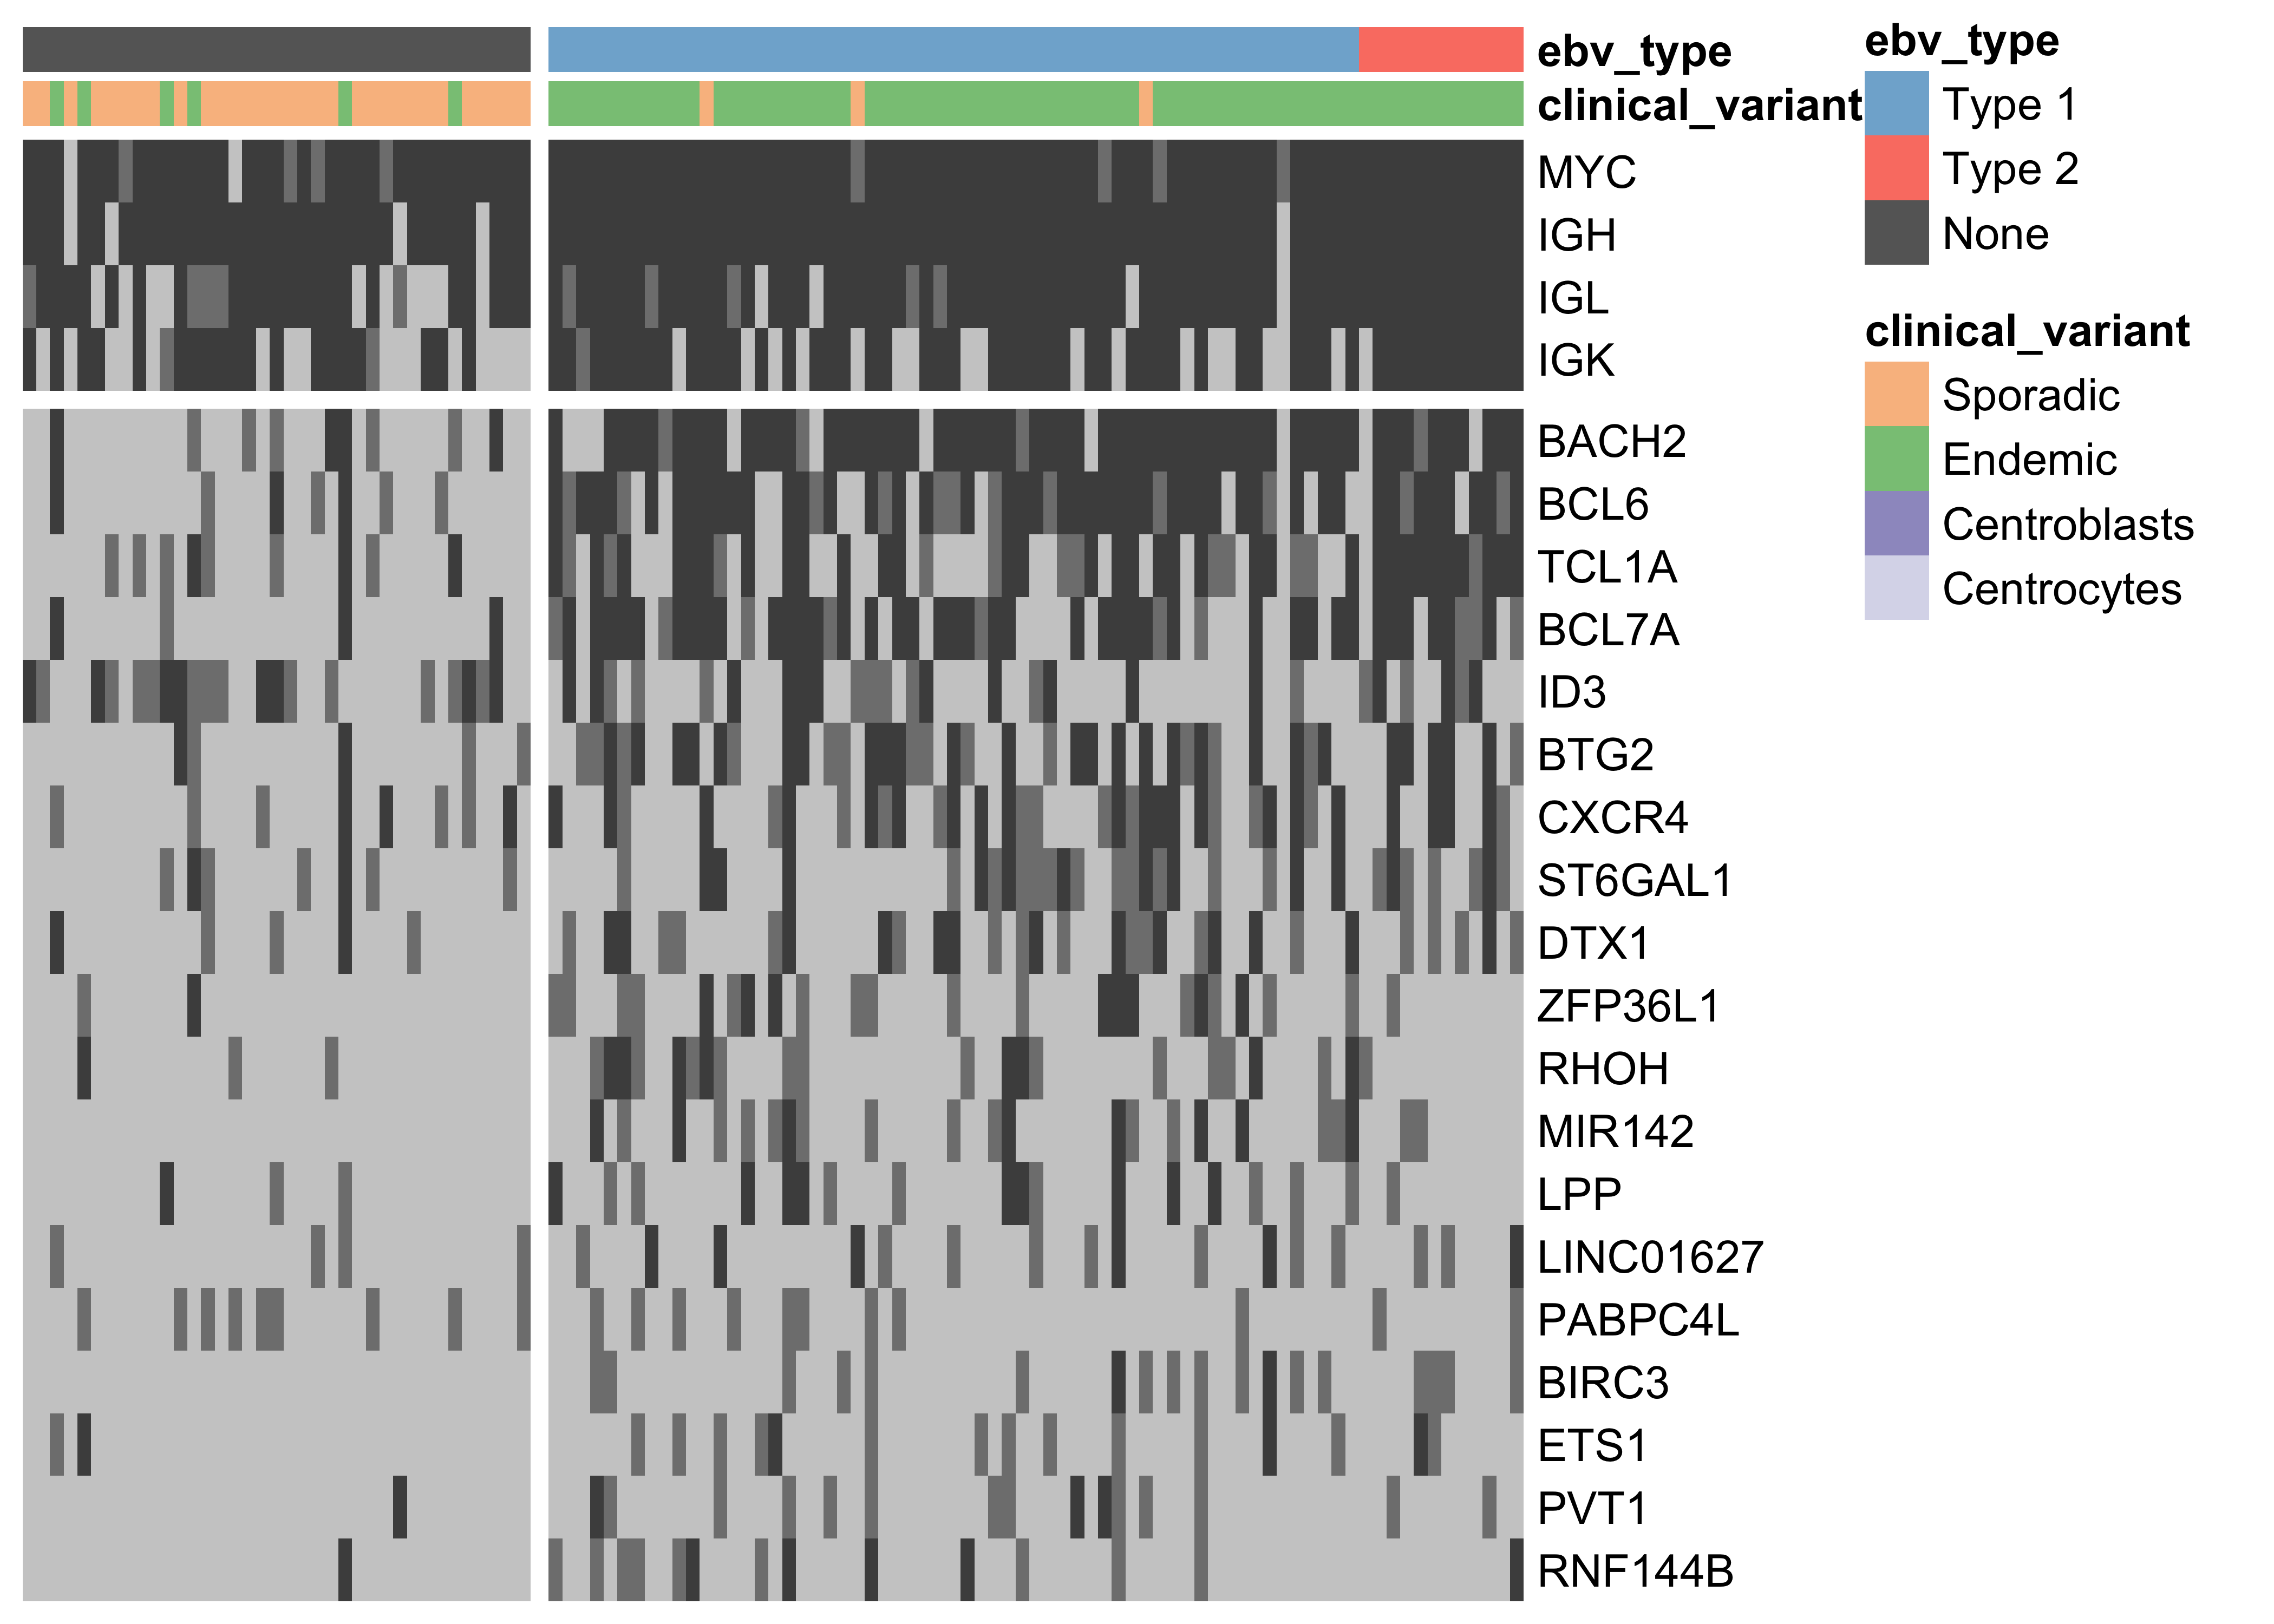
Figure 1: – Heat map showing the mutation rate of the most recurrently altered clusters of non-coding variants (altered in at least 15 cases). Clusters are labeled according to the nearest TSS (rows). Clusters that are associated with the same TSS are combined for plotting. Light gray denotes no mutations, and darker shades of gray indicate the presence of up to two mutations or more than two mutations, respectively.
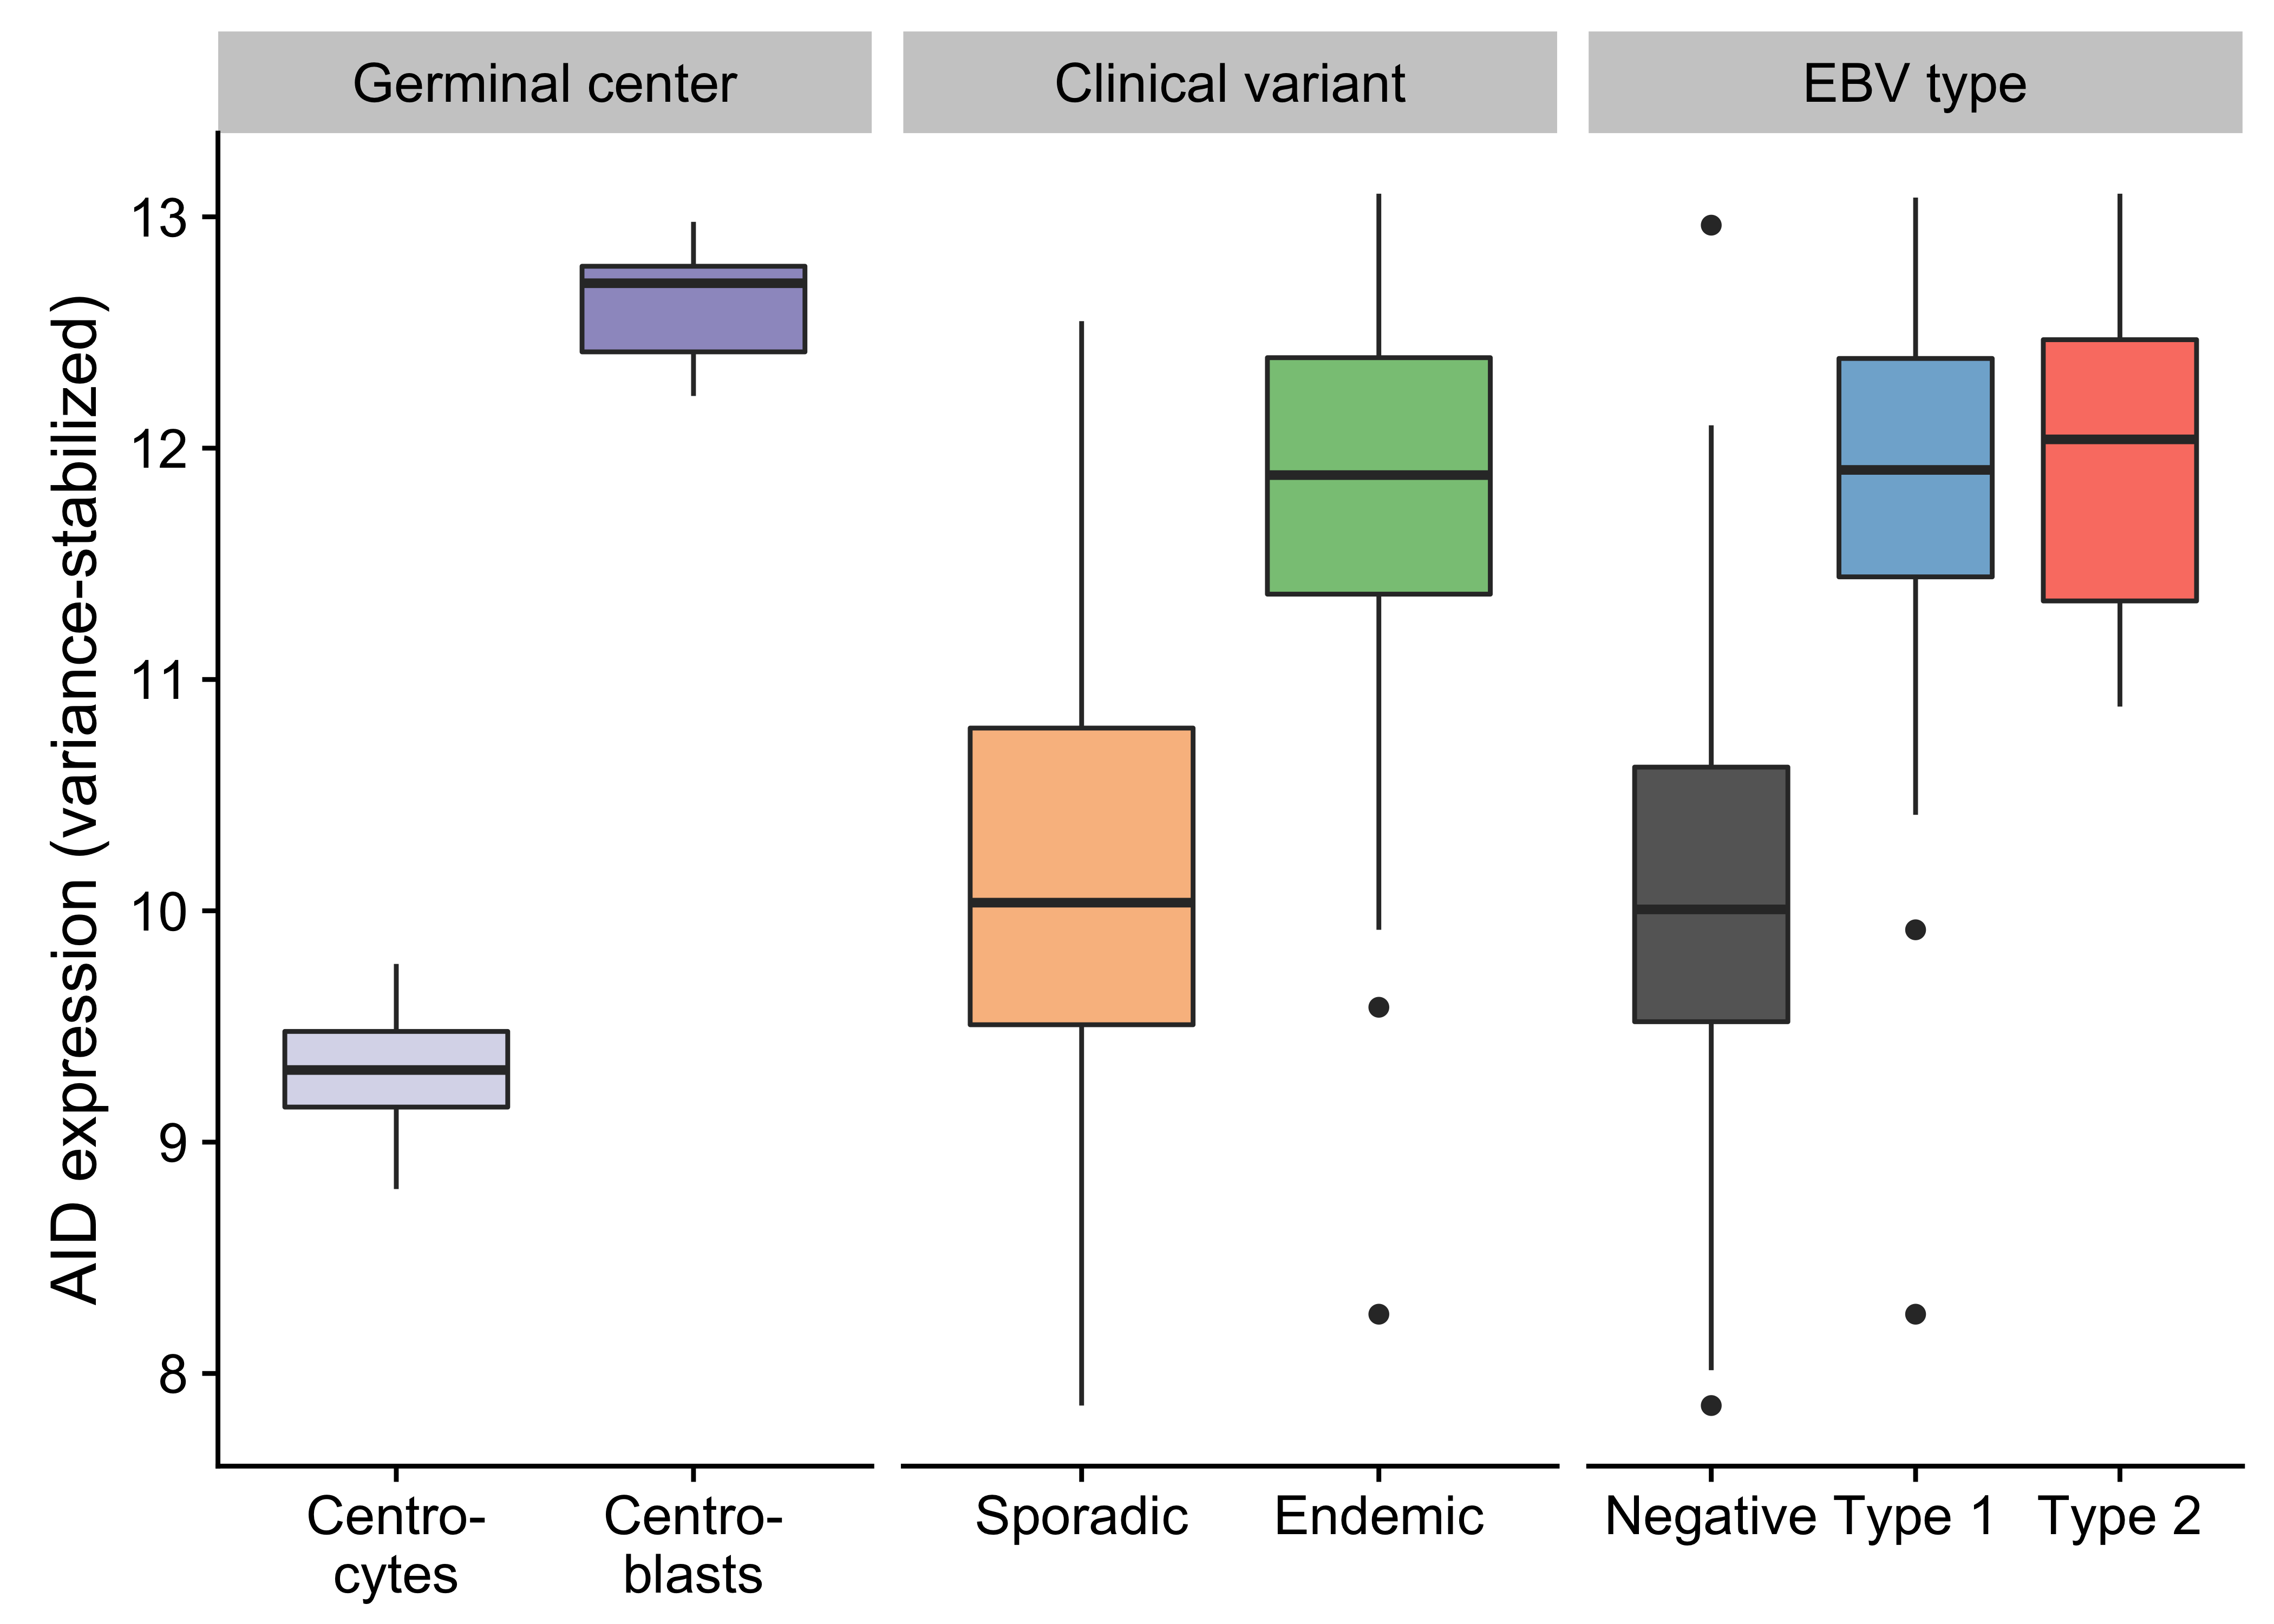
Figure 2: – Box plots showing the variance-stabilized expression of AID in germinal center cells and tumor samples (classified according to either clinical variant status or EBV infection status).
While several clusters of non-coding mutations overlap known targets of aberrant SHM, many affect genes that have not yet been linked to BL. One cluster overlaps a validated enhancer that is known to regulate the expression of PAX5, which plays an important role in B-cell differentiation. Mutations in this enhancer were first described in chronic lymphocytic leukemia (CLL)29, although we observe a higher mutation rate in BL (19% versus 11%). Unlike in CLL, the mutation status of this enhancer is not significantly associated with PAX5 expression (Supplementary Figure 14). Although, the trend toward higher PAX5 expression when the enhancer is mutated leads us to suspect AID-mediated SHM of this presumed active enhancer. Another target of non-coding mutations is the miR-142 locus. Variants affecting the mature sequence of miR-142 have been reported in DLBCL and FL in up to 20% of cases23,30, but not in BL despite being investigated in one of those studies. We observe 3 cases (2.8%) with mutations in the mature sequence of miR-142-3p. Most mutations in this cluster are actually located one kilobase upstream of miR-142. In total, these mutations affect 20% of our cases. Figure 1 shows that they are exclusive to EBV-positive cases (P-value 0.0000302, Fisher’s exact test). It is possible that these variants disrupt a regulatory element that modulates the expression of the miR-142 or other nearby genes. While we did not observe a difference in expression for miR-142-5p (P-value 0.477) or miR-142-3p (P-value 0.63) based on the mutation status of this cluster, a number of nearby genes were differentially expressed (Supplementary Figure 15).
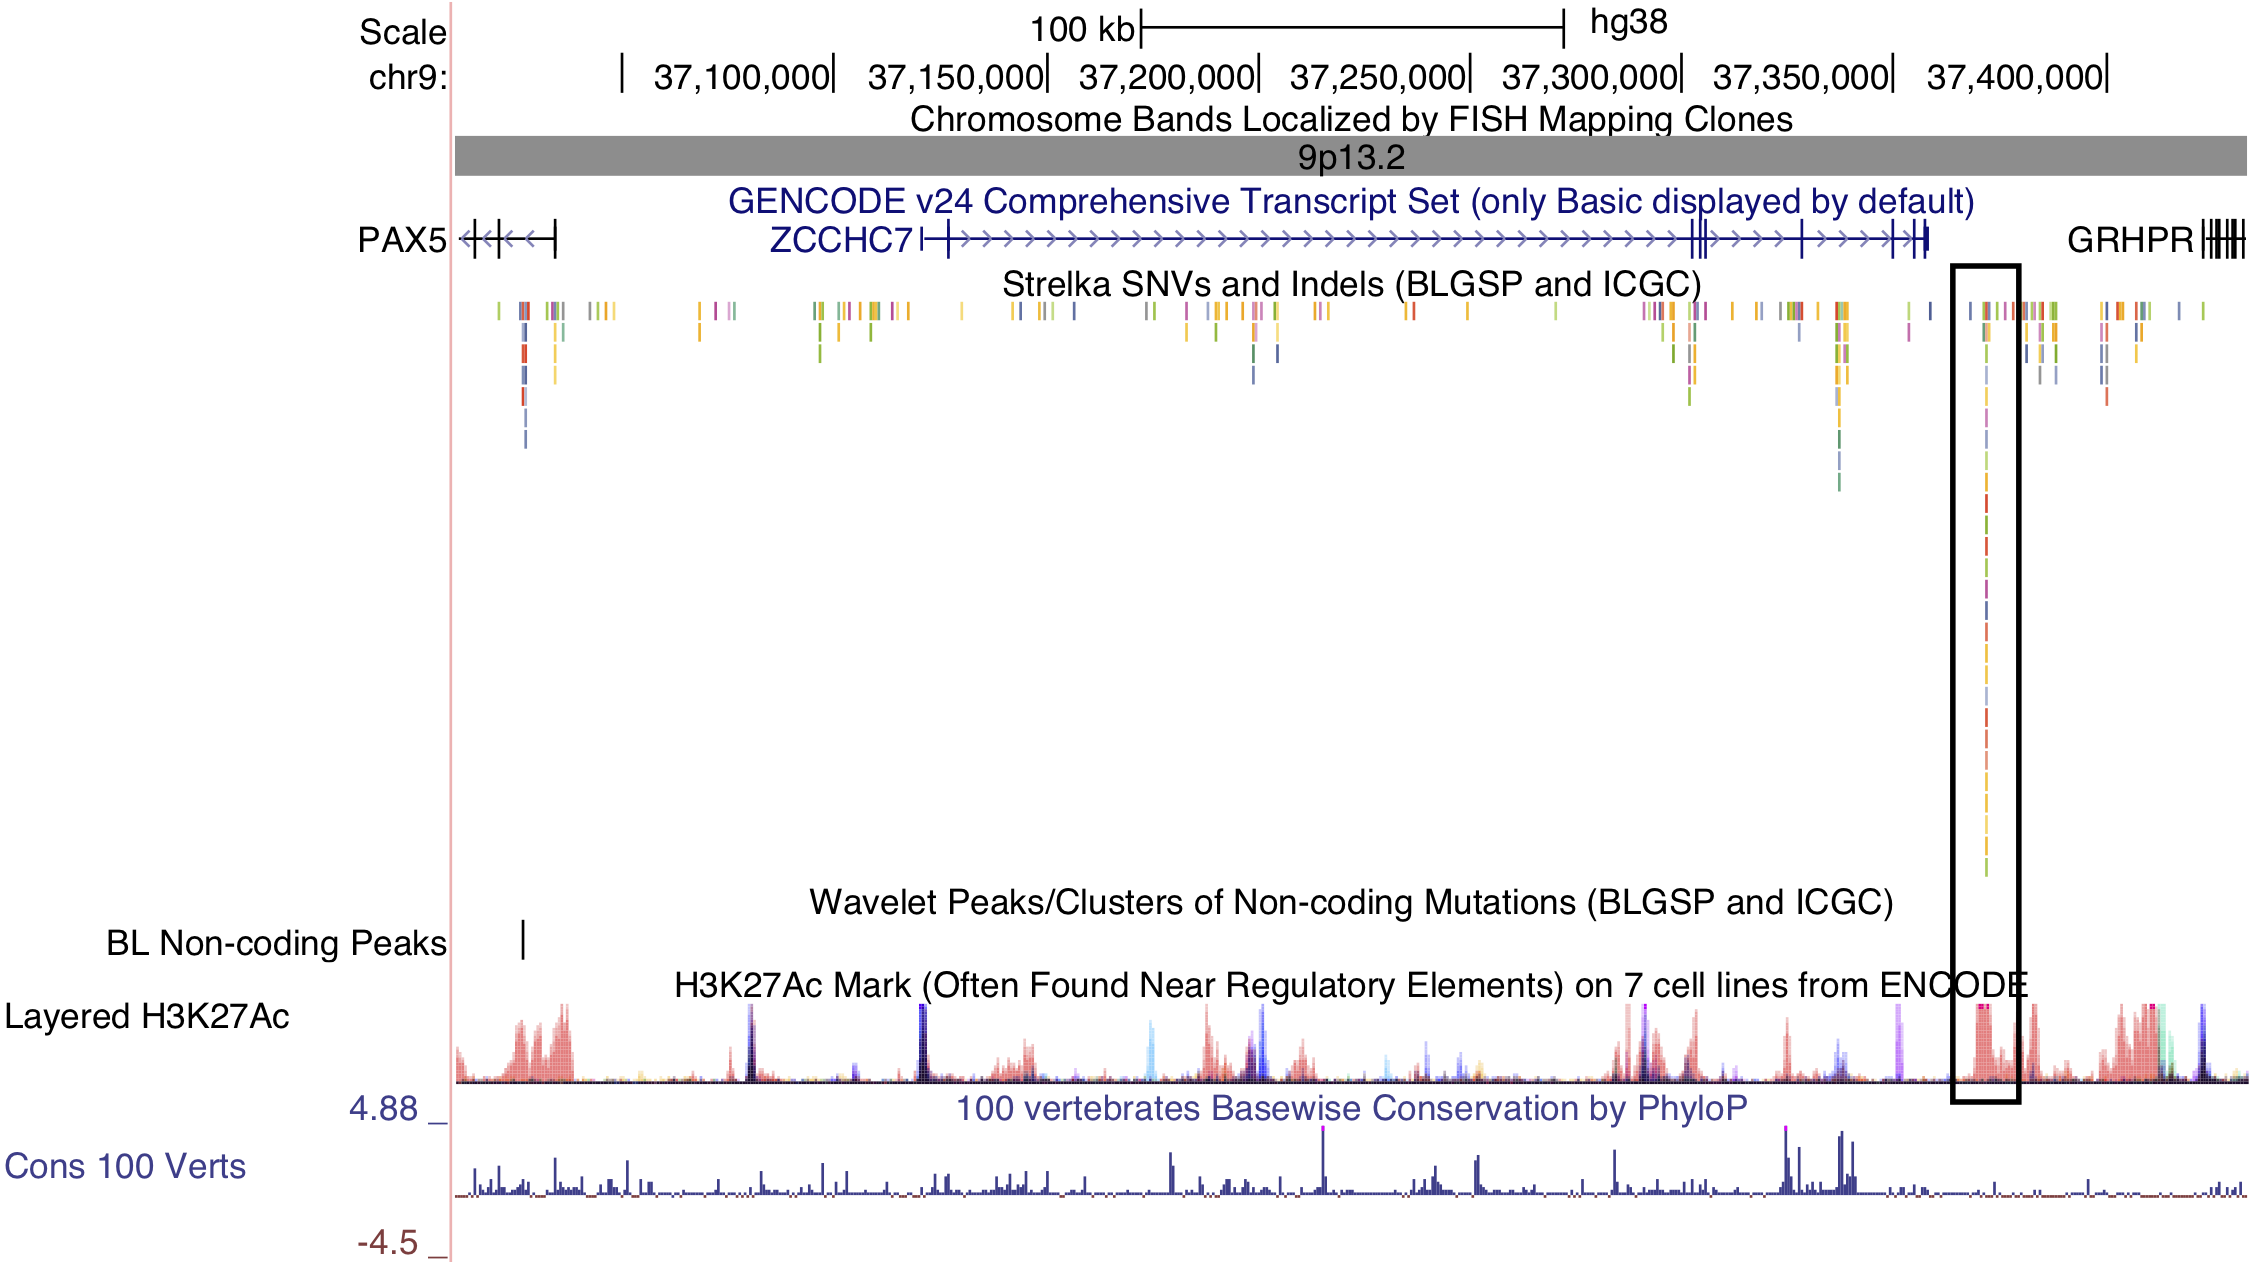
Figure 3: – Non-coding mutations in the PAX5 enhancer. The cluster in question is indicated by a black outline on the right-hand side. PAX5 is located on the left-hand side. Note the overlap between the cluster of non-coding mutations and the peak in histone 3 lysine 27 (H3K27) acetylation.
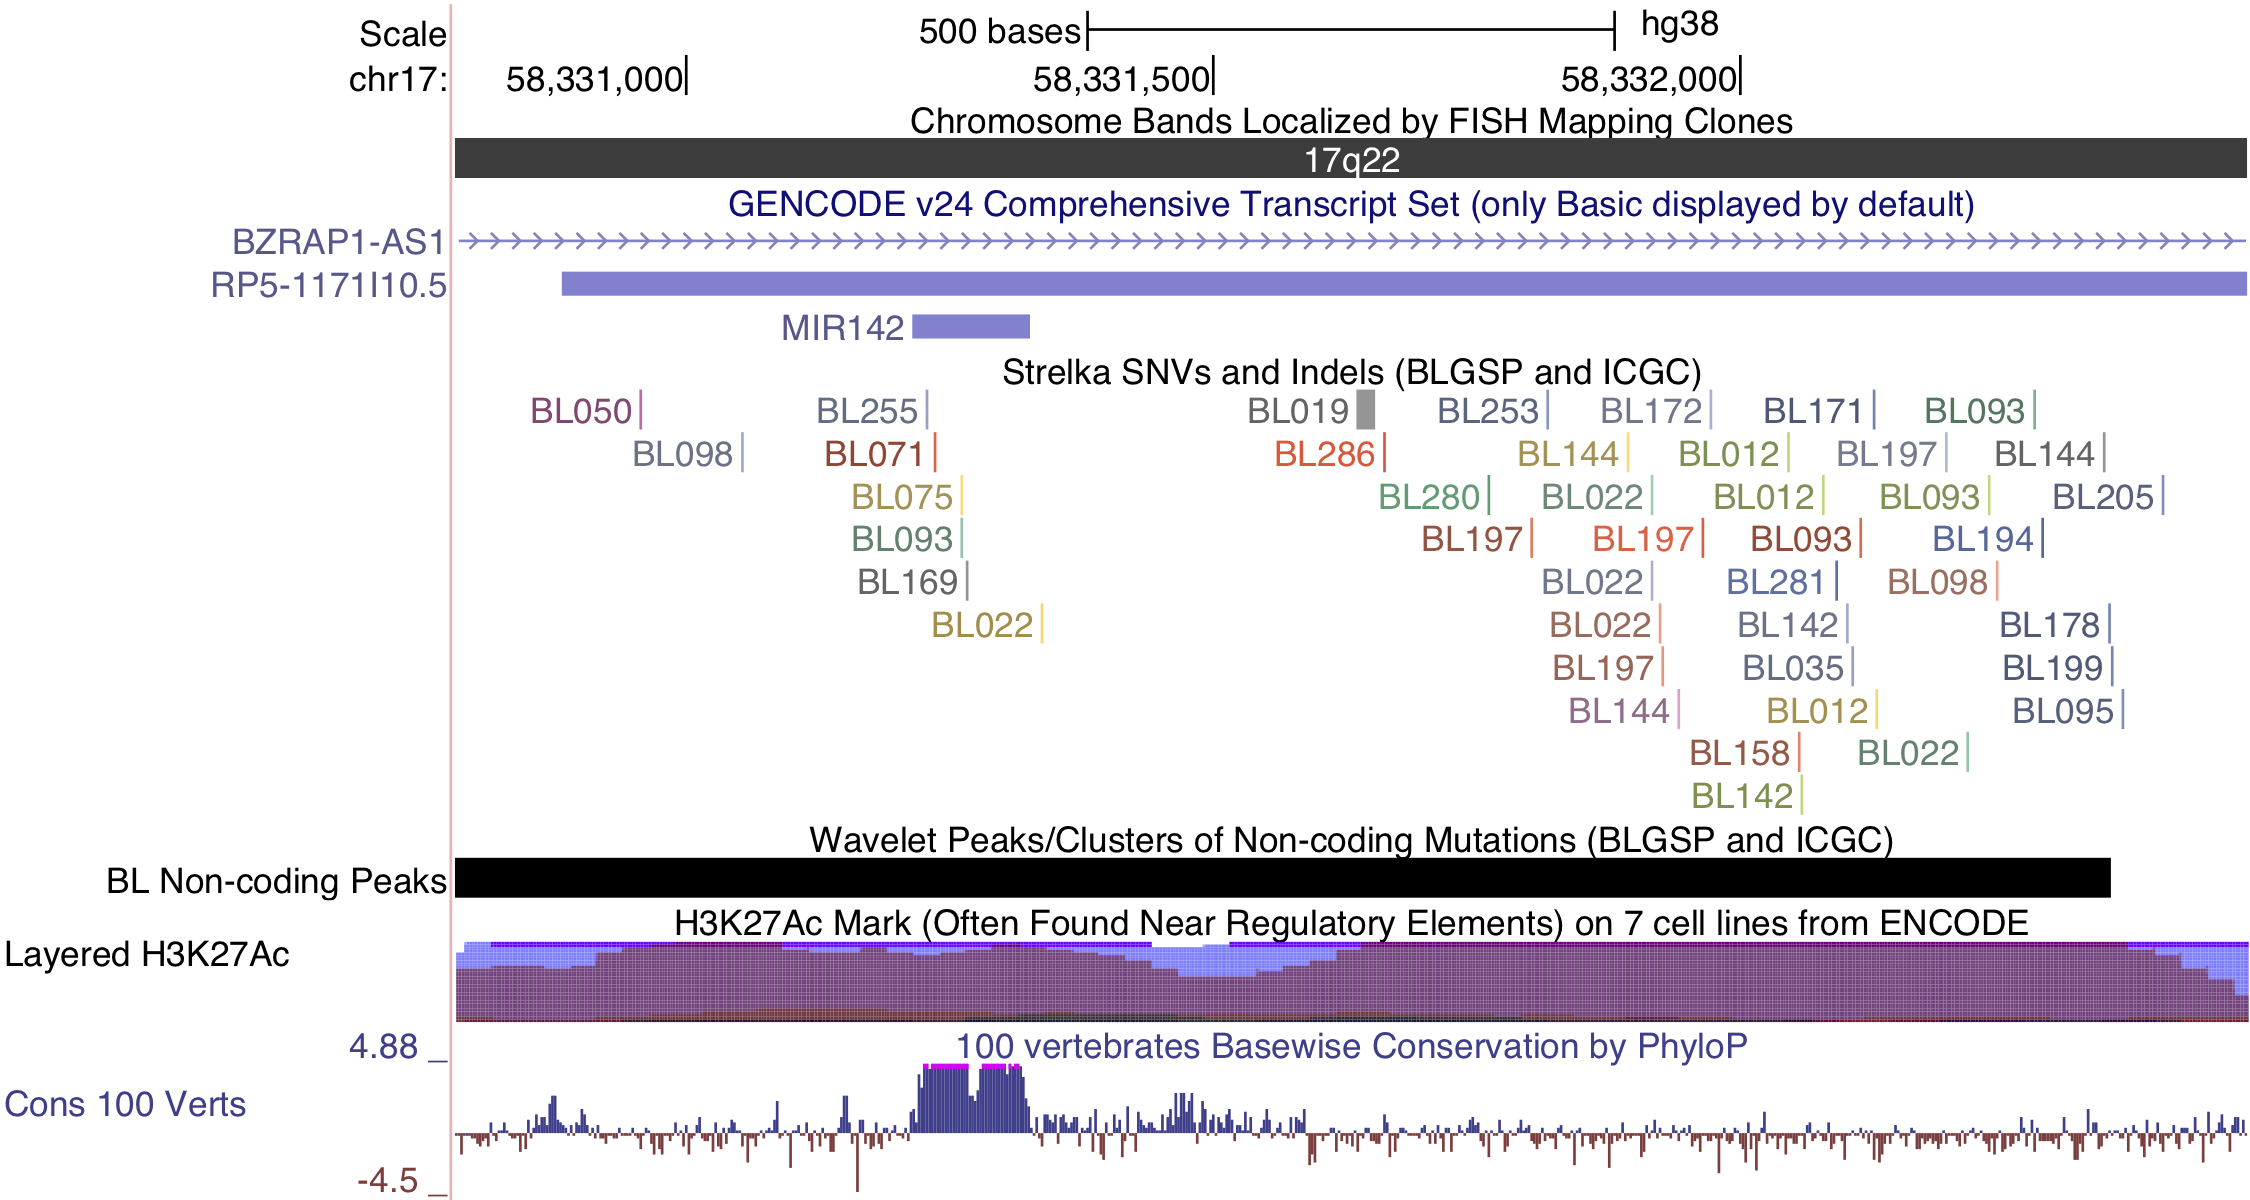
Figure 4: – Non-coding mutations in proximity of miR-142.
Lastly, a cluster of non-coding mutations seem to target the promoter region of the PVT1 non-coding locus, which encodes the PVT1 long non-coding RNA (lncRNA) and multiple miRNAs including miR-1204. PVT1 is 60 kilobases downstream from the MYC locus and often harbours IG-MYC translocations due to this proximity. It is also a target of Myc-mediated upregulation31, which may account for its high expression in BL tumors. The median expression values in transcripts per million (TPM) for MYC and PVT1 are in the 99th percentile. Paradoxically, this locus has also been identified as a p53-inducible target gene32. The cluster in question is mutated in 15% of cases, and its mutation status is significantly associated with higher PVT1 expression (P-value 0.00811). Mutations in this cluster are also significantly associated with EBV-positive tumors (P-value 0.00986, Fisher’s exact test; Figure 1). Given p53’s role in inducing the expression of this non-coding locus, we sought to identify any enrichment of mutations in p53 binding sites genome-wide, defined by chromatin immunoprecipitation paired-end tag sequencing (ChIP-PET) peaks33. One such peak overlapped the PVT1 promoter region and cluster of non-coding mutations, and was deemed significantly mutated by these non-coding variants (Benjamini-Hochberg (BH)–adjusted P-value 0.0508, OncodriveFML). While the driver status for these mutations needs to be functionally validated, unpublished work has shown that PVT1 acts as a tumor suppressor gene in BL by lowering MYC expression. These mutations highlight a potential role for AID in promoting BL formation through non-coding mutagenesis of biologically relevant targets.
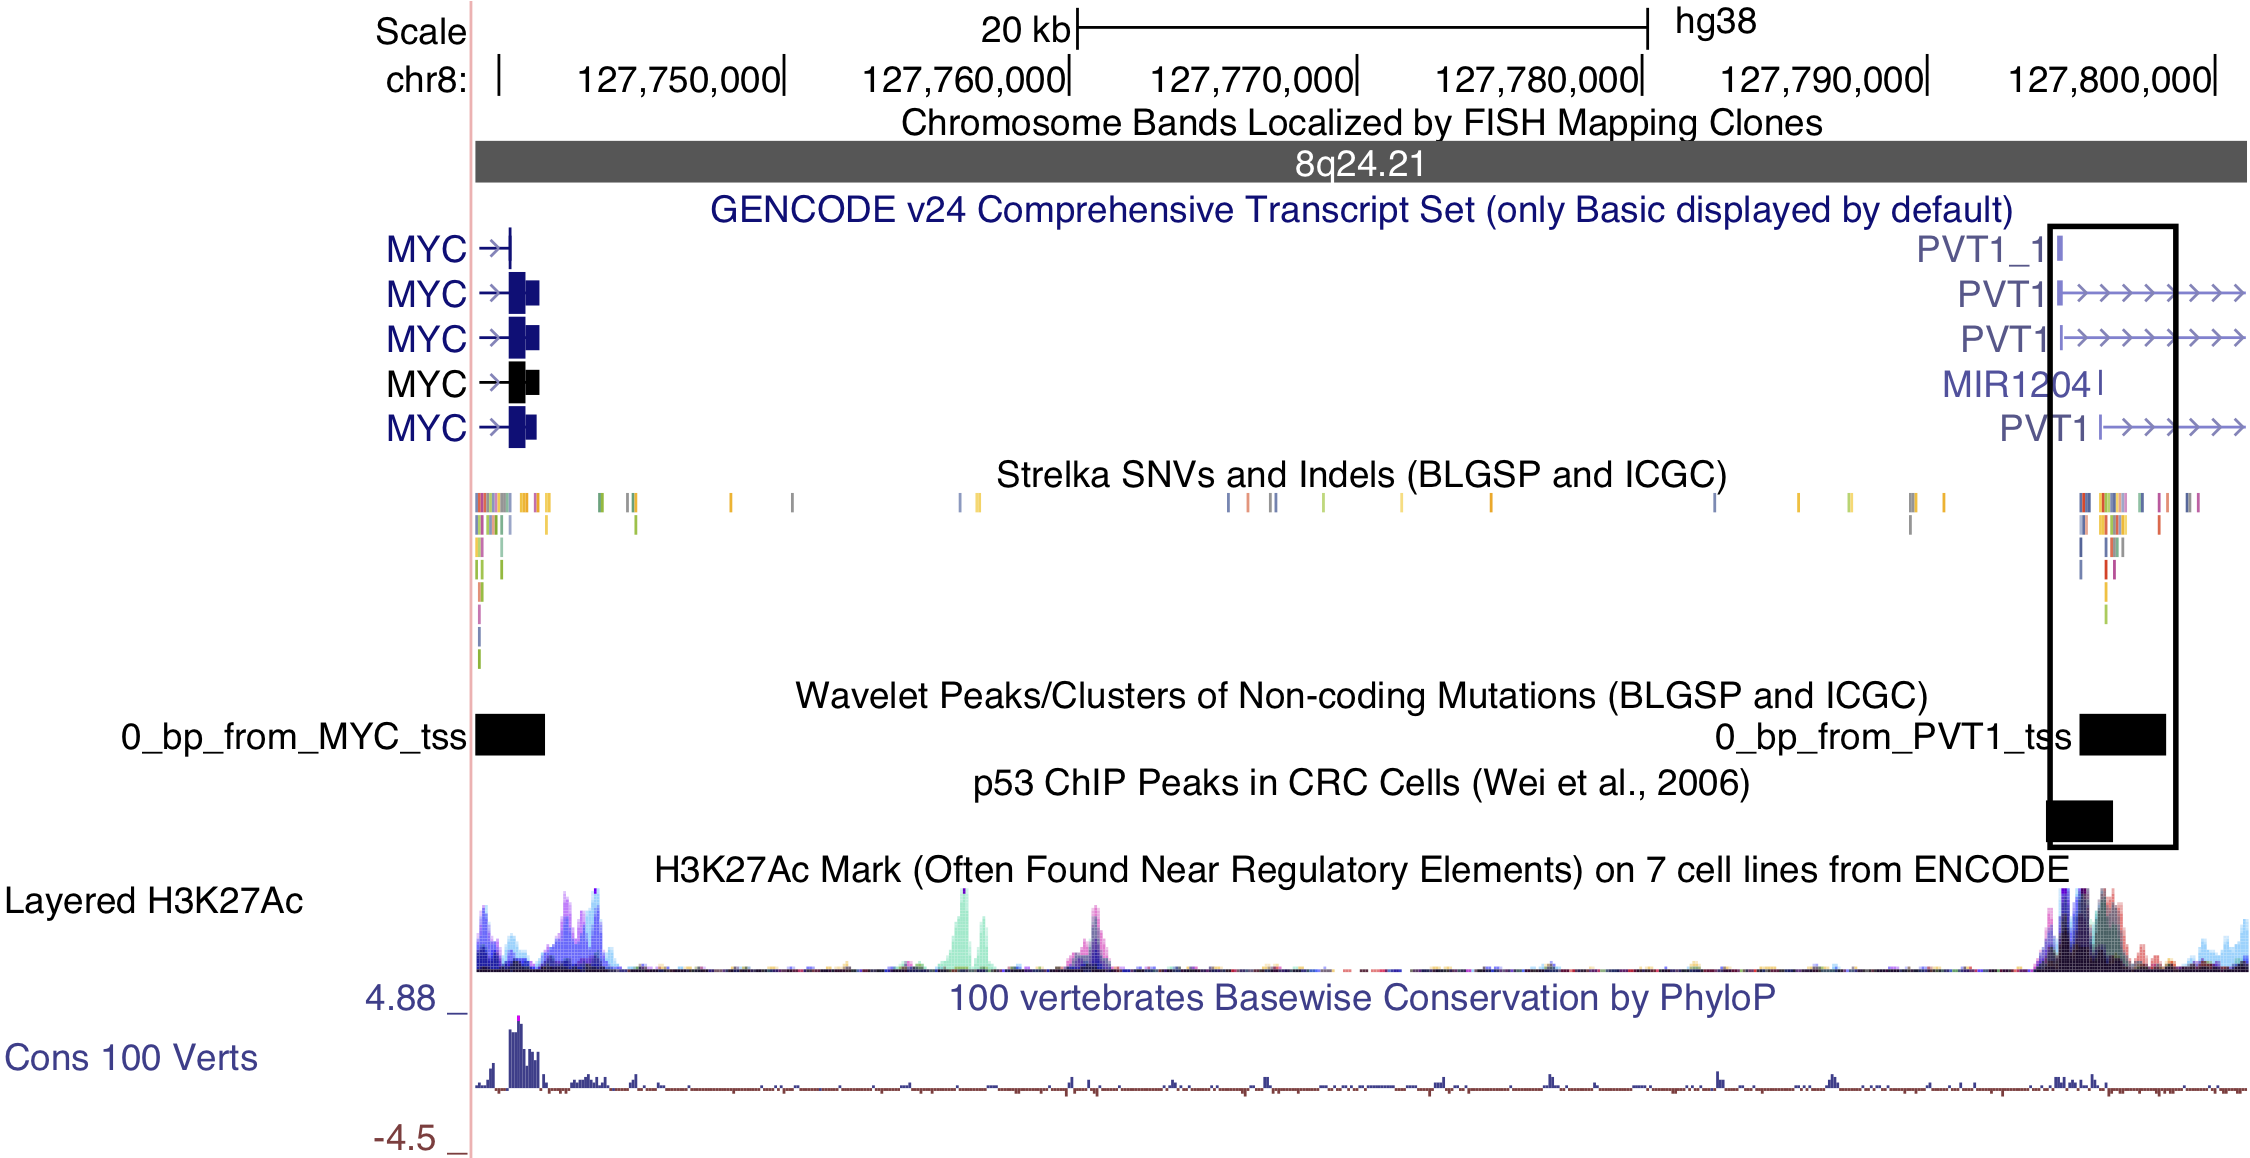
Figure 5: – Non-coding mutations in the PVT1 promoter region. Note the p53 chromatin immunoprecipitation (ChIP) peak that overlaps the mutations in this cluster.
Differential AID expression is not related to cell-of-origin
Figure 2 shows that the difference in AID expression between EBV-positive and -negative tumors approaches the difference between germinal center centroblasts and centrocytes. This led us to hypothesize that these differences in AID expression may be caused by differences in the tumors’ germinal center cell-of-origin. To test this hypothesis, a supervised approach was devised to compare the expression profile of each tumor with that of centroblasts and centrocytes using a weighted voting algorithm34,35. The algorithm used 118 genes that are differentially expressed between dark zone and light zone cells. This resulted in a centroblast score for each tumor scaled between –1 and 1, where positive and negative scores indicate a greater similarity to centroblasts and centrocytes, respectively. The majority of tumors (89%) are more similar to cells from the germinal center dark zone in terms of gene expression. This is consistent with previous reports that BL tumors derive from centroblasts36,37. However, we note the existence of a minority of BL tumors (11%) that are more similar to centrocytes. Heterogeneity in the cell-of-origin has been previously described; although in that study, most BL tumors were more similar to centrocytes35. The difference in centroblast score between EBV-positive and -negative cases is small but significant (P-value 0.0272, Wilcoxon test). The same is true between clinical variants (P-value 0.0156). However, the difference in centroblast score does not have the same magnitude as the difference between centroblasts and centrocytes. Therefore, it seems unlikely that cell-of-origin alone can account for the significantly greater AID expression in EBV-positive tumors. Of note, recent work has shown that EBV is capable of inducing AID expression in lymphoblastic cell lines (LCLs)38. EBV achieves this effect through durable epigenetic changes of the AID gene locus, which is mediated by the protein encoded by the latent gene EBNA3C. Our findings seem to extend this observation to BL tumors in vivo and potentially implicate EBV in promoting AID-mediated mutagenesis in EBV-positive tumors.
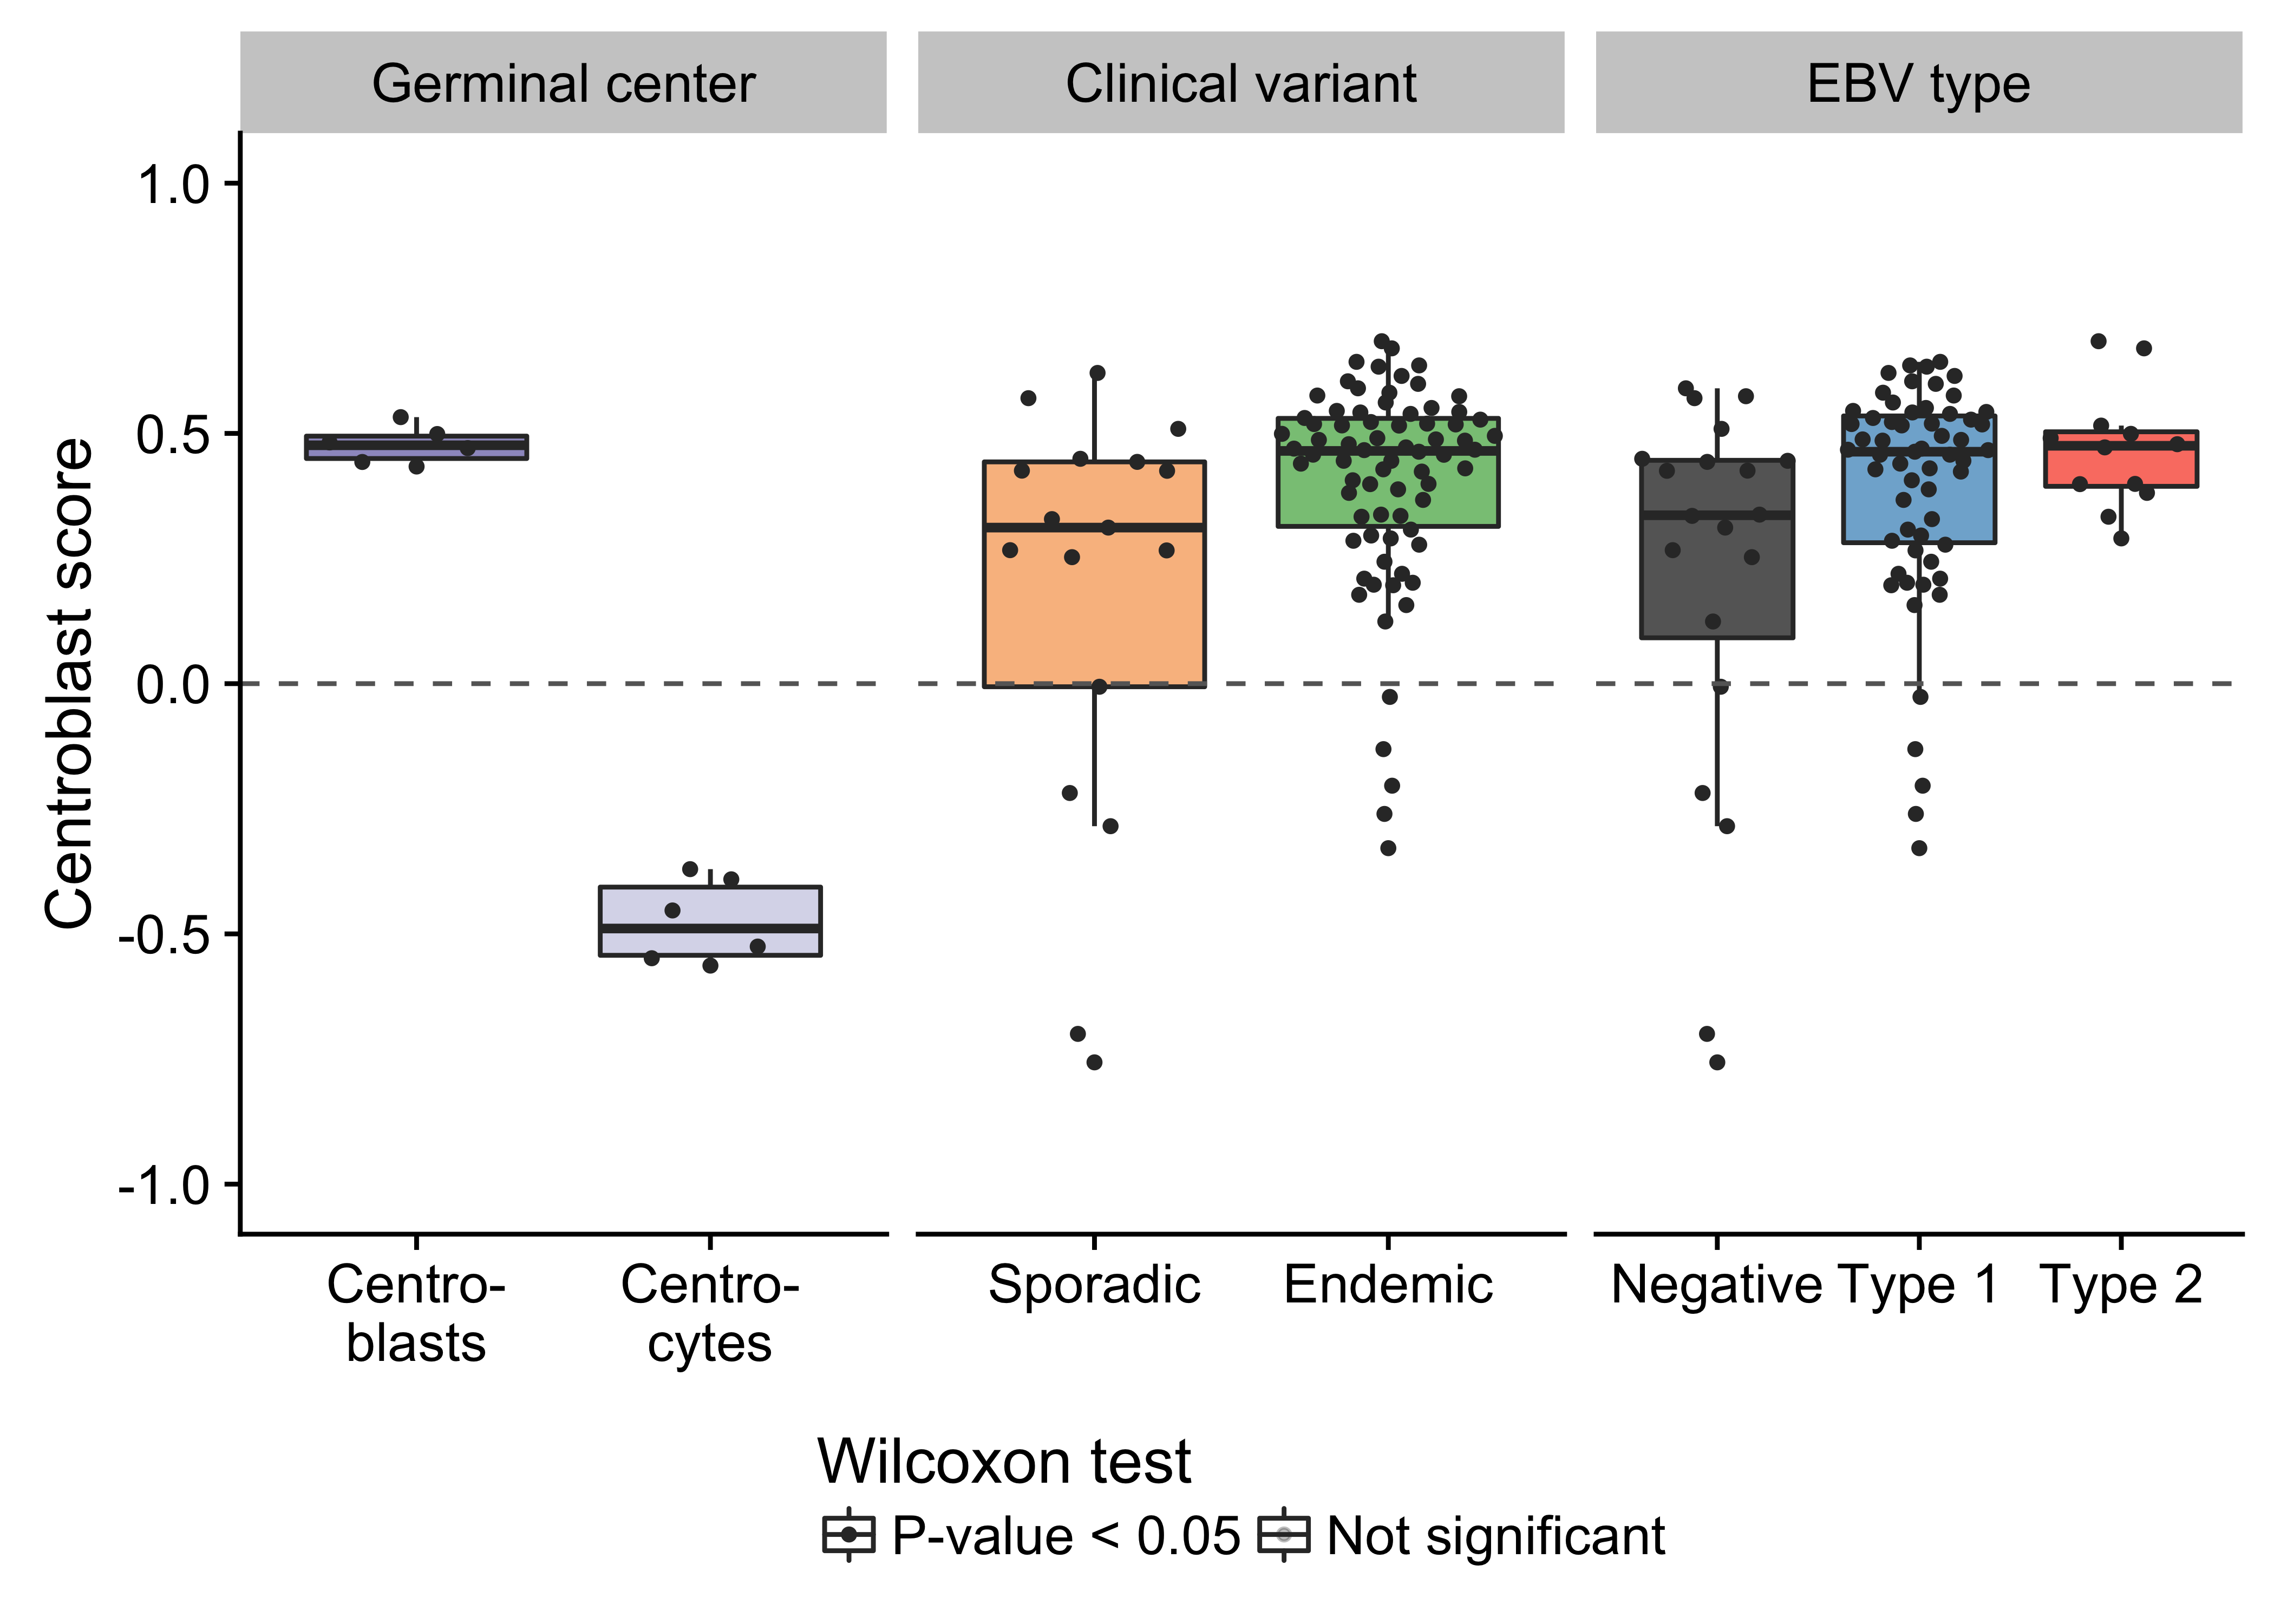
Figure 6: – Box plots showing the centroblast score for germinal center cells and tumor samples (classified according to either clinical variant status or EBV infection status). Positive and negative scores correspond to greater similarity to centroblasts and centrocytes, respectively.
Structural deregulation of MYC expression
Simple IG-MYC translocations were identified in all but two cases, with a majority involving IGH and the remainder associated with IGL and IGK (Table 1). In one case (BL123), we detected two t(3;8)(q27;q24) rearrangements near BCL6 and MYC. Similar events have been previously described in BL and DLBCL39–42. Interestingly, the breakpoints for each translocation flank focal gains at each locus. Based on the orientation of the translocations, these regions may form part of a double minute consisting of the 3’ portion of MYC (after codon 79) and a portion of the BCL6 super-enhancer. The effect of truncating the first 79 codons of MYC is not clear though. A deletion mutant screen showed that deleting codons 3–53 resulted in a partially functioning protein, while deleting codons 7–91 led to inactivation of MYC43. MYC expression is still significantly higher than the normal germinal center cells (fold change 5.2). We also note the uneven coverage across the exons in the RNA-seq data, with a sharp increase after codon 79 (Supplementary Figure 17). The remaining case (BL277) harbors a complex three-way rearrangement (t(8;14;17)(q24;q32;q24)) involving MYC, IGH, and a locus proximal to GNA13 on chromosome 17. The fold change in MYC expression over that in centroblasts and centrocytes is also high (fold change 6.4). We also inspected the expression of genes within one megabase of the breakpoint on chromosome 17 (Supplementary Figure 18). GNA13 is the only gene in this region with an established role in BL, a bona fide tumor suppressor gene. While its expression is paradoxically high in this tumor, a somatic splice site mutation that causes the skipping of exon 2 has a variant allele fraction of 86%, indicating that this region has underwent loss-of-heterozygosity. The RNA-seq data confirms that most GNA13 transcripts lack exon 2 and are thus predicted to be non-functional (data not shown).
Despite MYC being deregulated in all tumors by structural alterations, one EBV-positive endemic case harbored both an IGH-MYC translocation and a chromosome 11q aberration with the characteristic proximal gain and distal loss. It is not possible to determine the chronology of these structural variations with the available data, which would determine whether the MYC translocation superseded the 11q aberration. The 11q abnormality has been previously associated with MYC-negative cases44 and prompted the creation of a new entity, Burkitt-like lymphoma with 11q aberration, in the 2016 revision of the World Health Organization (WHO) classification of lymphoid neoplasms45. Recent work has demonstrated the existence of sporadic BL tumors harboring both events46,47, and we extend this observation to an EBV-positive endemic case.
IGH gene usage for productive allele
Given the important role for the B-cell receptor (BCR) in BL, we sought to characterize the immunoglobulin (Ig) heavy (IGH) and light (IGK/IGL) chains of the productive (i.e. expressed) allele. The MiXCR tool was applied to the RNA-seq data from our BLGSP cohort in sensitive mode in order to identify Ig clonotypes48,49. Dominant clones were defined as those with a clonal fraction above 30% with at least 30 supporting reads to minimize spurious results (Supplementary Figure 19). Following this approach, we identified a dominant heavy chain clone in 70 cases (77%) and a dominant light chain clone in 79 cases (87%). There are 3 cases with more than one dominant heavy chain clone. On the other hand, there are 20 cases that co-express a dominant IGK clone and a dominant IGL clone. It is not clear whether this heterogenous expression pattern is due to tumor cells expressing both IGK and IGL light chains. Ig gene usage in BL is non-uniform (Figure 7), providing evidence for BCR steoreotypy. There is no differential gene usage according to clinical variant or EBV infection status (BH-adjusted P-value < 0.1, Fisher’s exact test). We replicate previous work showing an enrichment for IGHV4-34 and IGHV3-30 among IGHV genes50–52. Furthermore, there is a striking enrichment for IGKV3-20 among IGKV genes. IGKV3-20 stereotypy has been described in other B-cell lymphoproliferations, commonly in combination with IGHV4-59, and has been linked to rheumatoid factor activity53. While we see that combination in 2 cases, we observe IGKV3-20 pairing with IGHV4-34 more commonly in 5 cases (Supplementary Table 2). If IGKV3-20 stereotypy is a result of its auto-reactivity, this would suggest that antigen-dependent BCR signaling may complement antigen-independent (tonic) signaling in promoting BL cell growth and survival12.
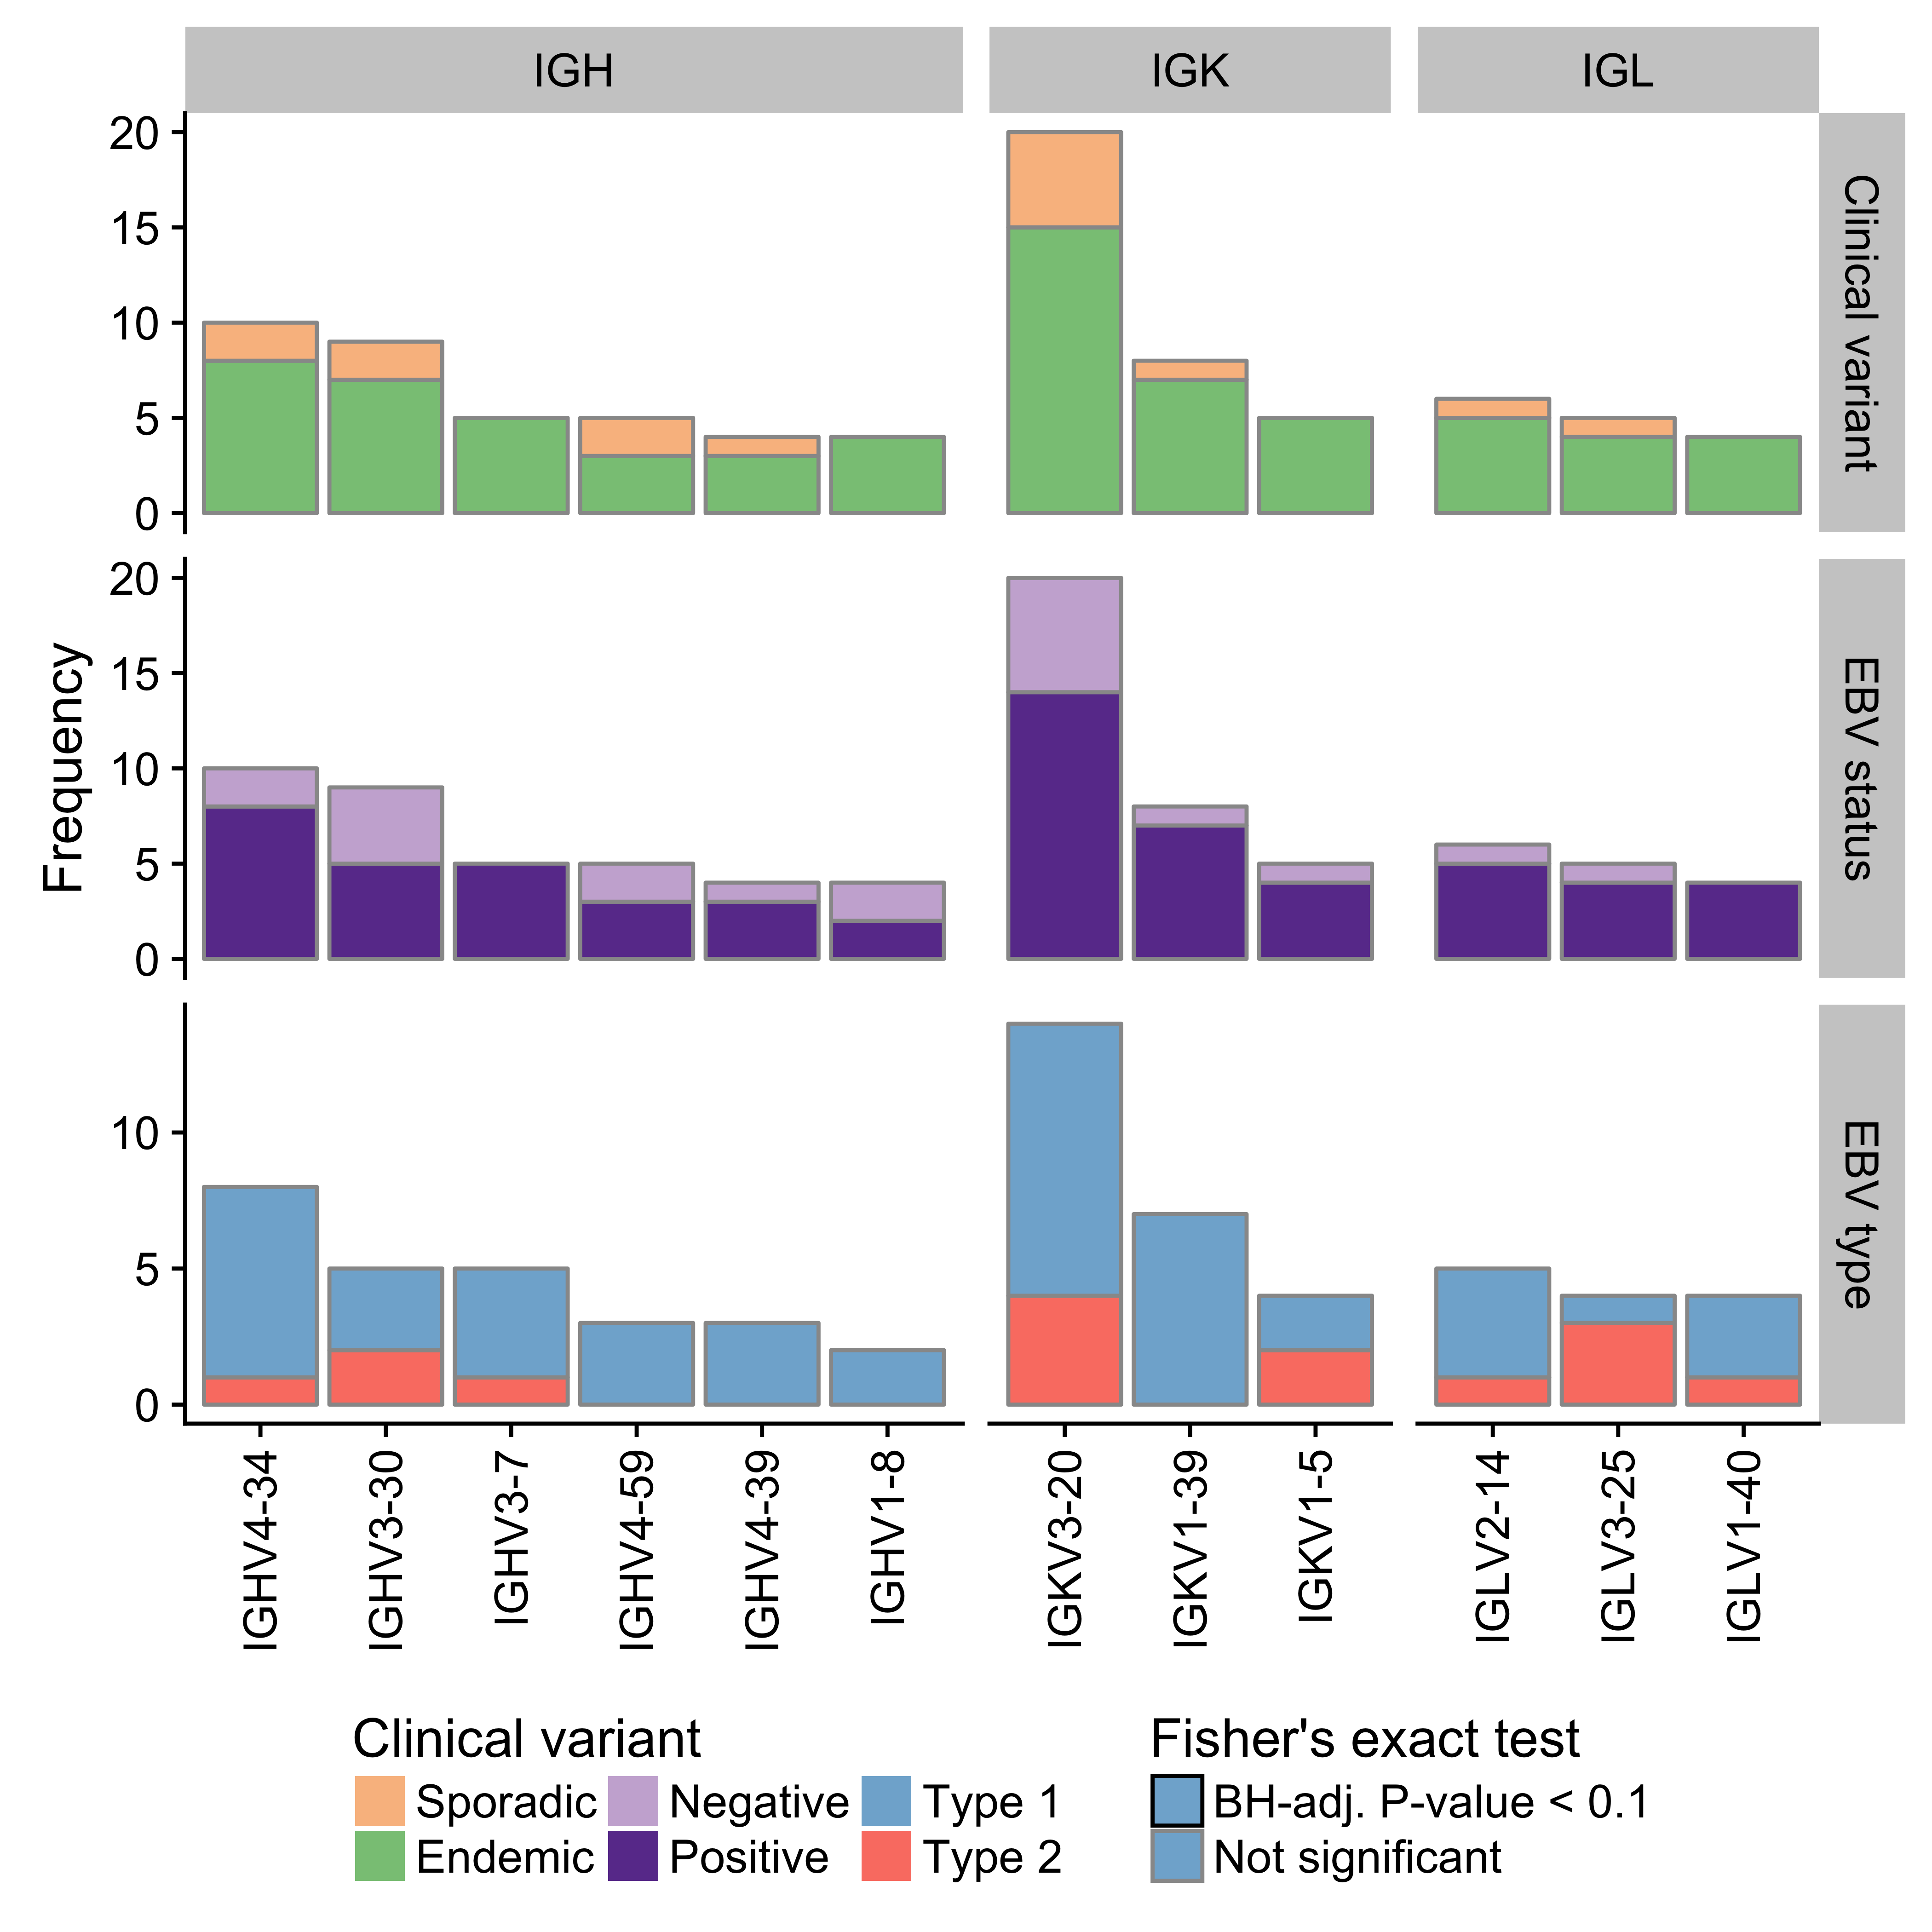
Figure 7: – Frequency of immunoglobulin V gene usage among dominant heavy (IGH) and light (IGK/IGL) chain clones. Only displaying genes with a minimum frequency of four. No Ig genes were significantly associated with either clinical variant status, EBV infection status or EBV genome type.
Mutation burden varies according to EBV infection status
We compared the mutation burden between different BL subtypes to identify potential differences with respect to mutational processes. We only considered the BLGSP WGS data to avoid potential confounding effects due to differences in sequencing depth with the ICGC data. Genome-wide, the mutation load is significantly higher in endemic or EBV-positive cases compared to sporadic or EBV-negative cases, respectively (Figure 8). The same is true for non-synonymous mutations in all protein-coding genes. AID-mediated SHM might be the underlying cause for this significantly higher mutation burden in EBV-positive tumors. Interestingly, when we only consider non-synonymous mutations in significantly mutated genes as described below, the direction of the difference is reversed and remains significant only according to EBV infection status. This is despite the higher mutation burden genome-wide in EBV-positive cases. We were unable to replicate a previously reported significant difference in the number of mutations in BL genes according to EBV genome type22. This result supports an oncogenic role for EBV regardless of genome type and reinforces the notion that EBV infection status may be a more biologically meaningful method for classifying BL than geographic origin.
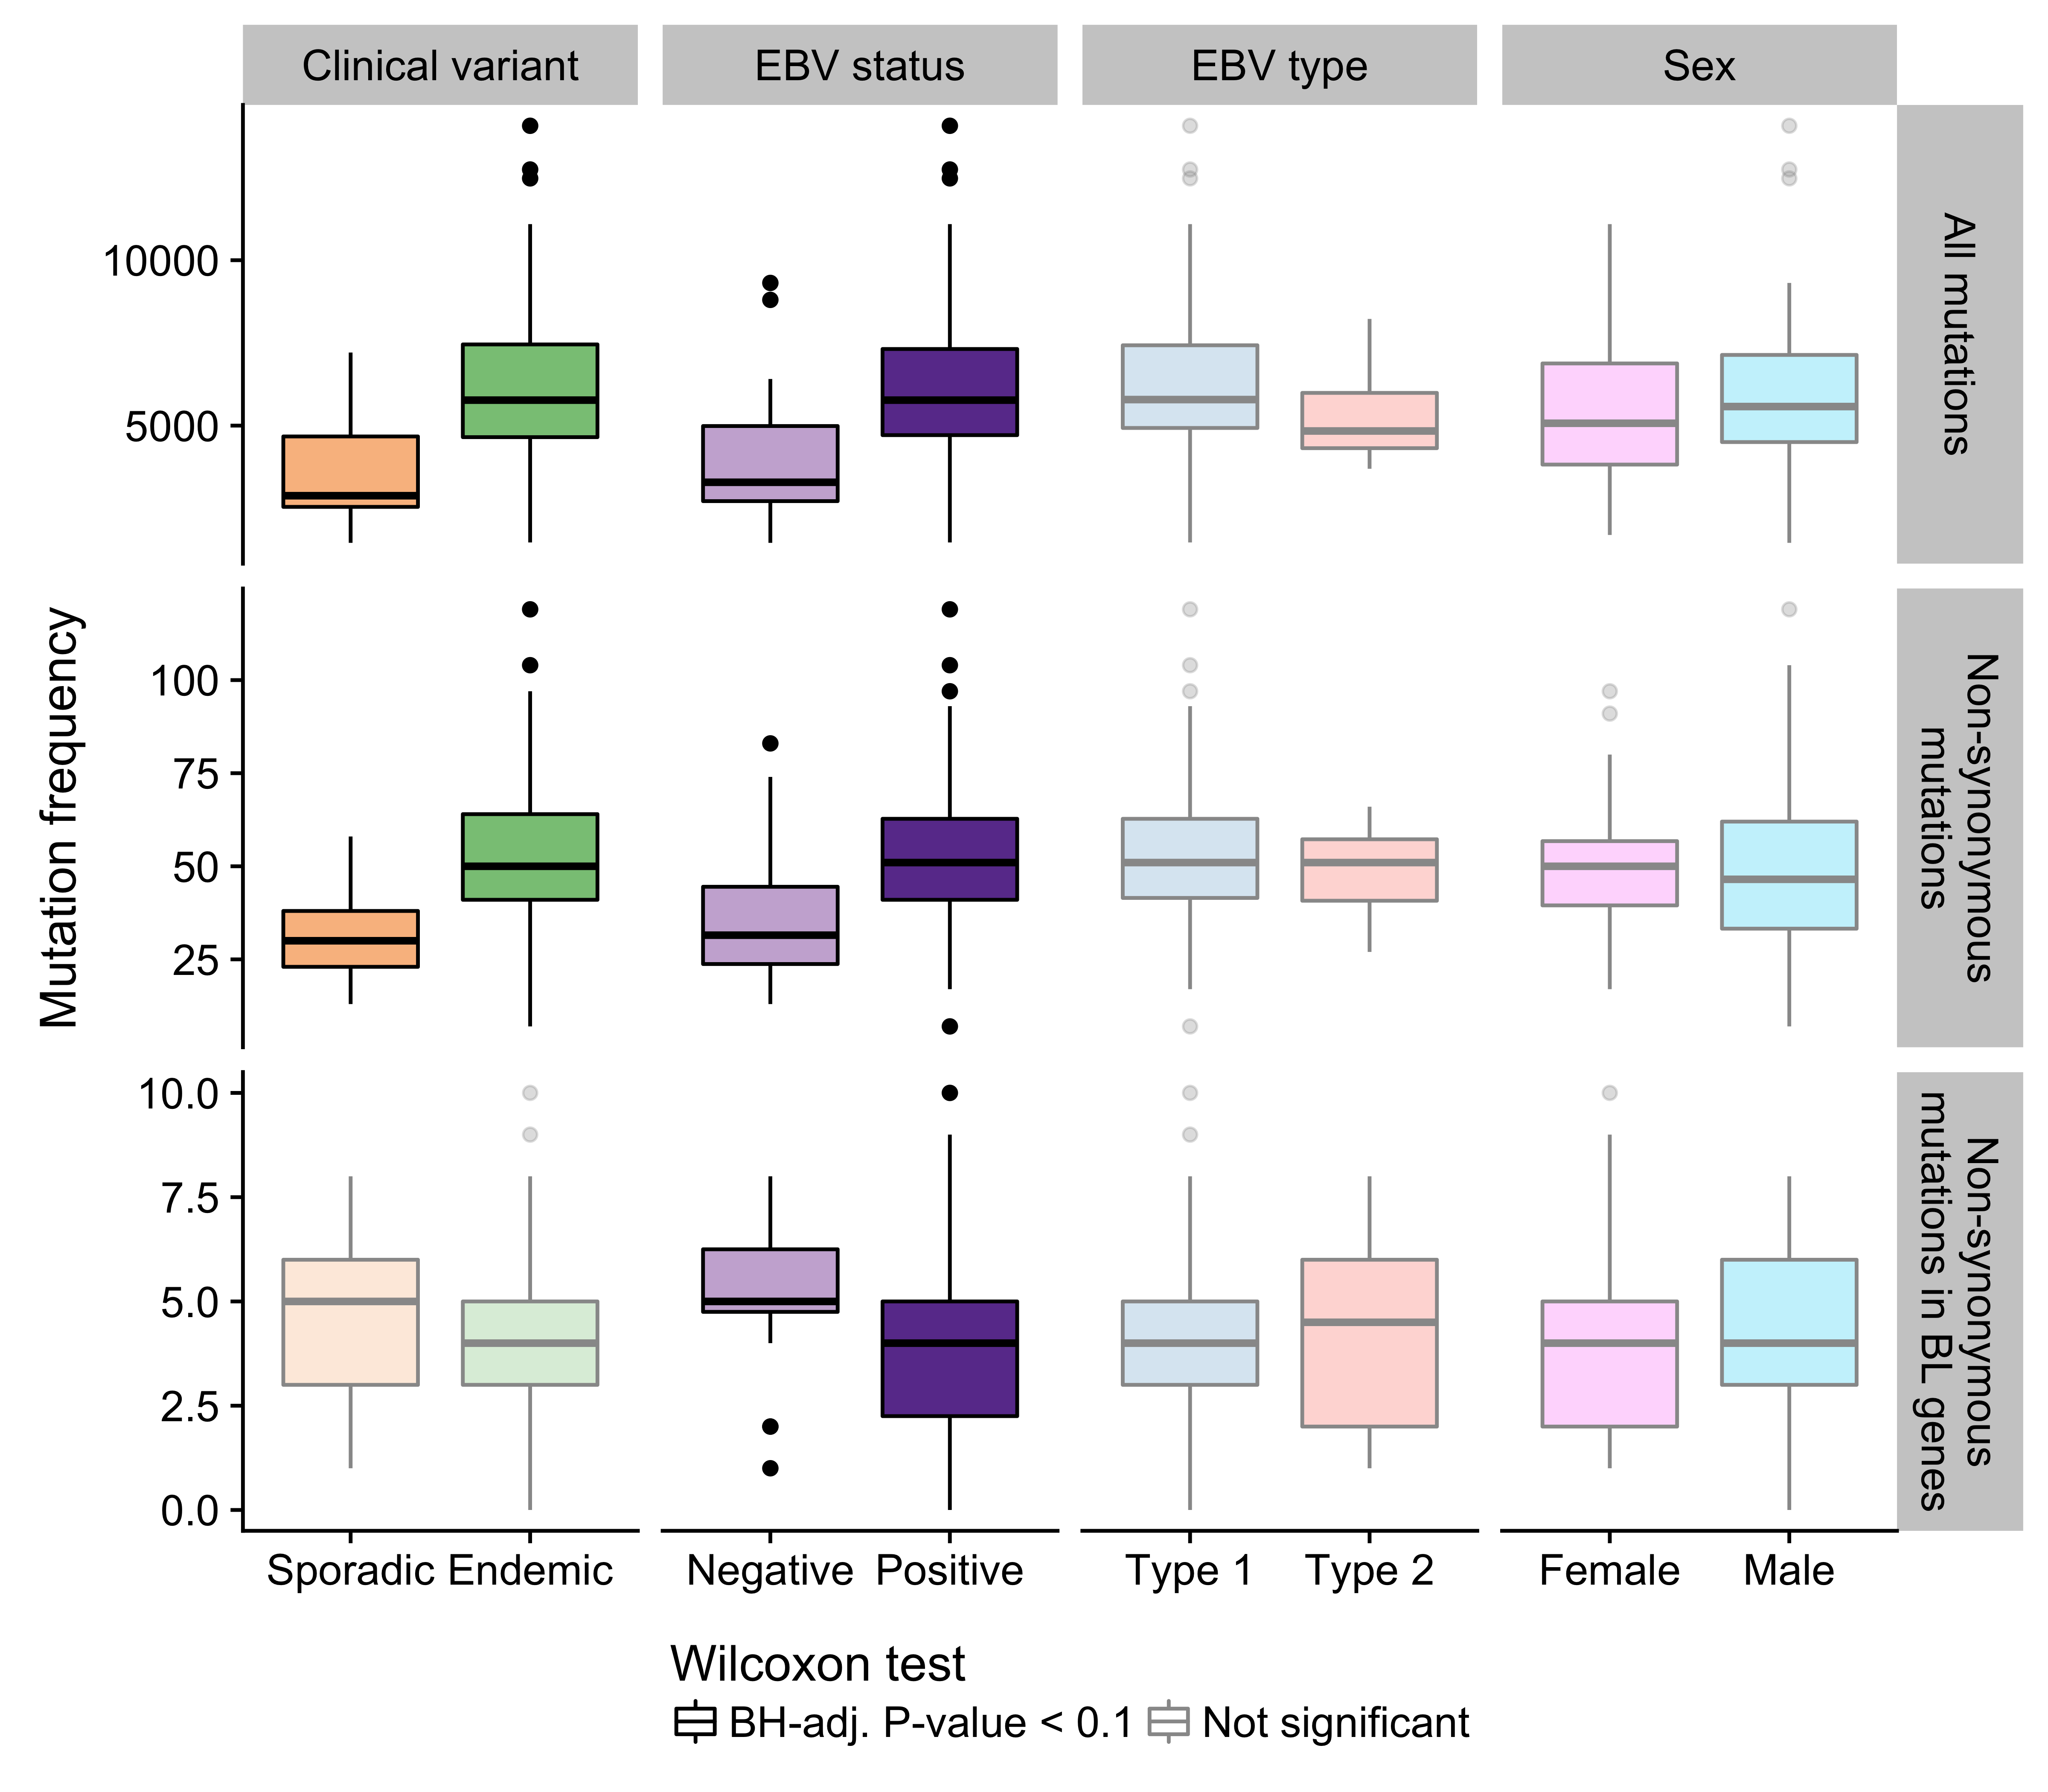
Figure 8: – Frequency of mutations genome-wide, non-synonymous mutations genome-wide, and putative driver mutations in significantly mutated genes in various disease subtypes.
Significantly mutated genes associate with EBV infection status
We identified significantly mutated genes (SMGs) by employing an ensemble approach that leveraged four methods and required support from at least two54–57 (Figure 9). Established BL genes figured on our list of SMGs, such as DDX3X, ID3, TCF3, ARID1A, SMARCA4, TP53, FOXO1, and CCND3. We were also able to replicate recently uncovered BL genes such as TFAP4 and KMT2D. On the other hand, we note the absence of somatic mutations in CCNF, which has been described in endemic BL21. The previously described hotspot mutation (R451C) exists in two endemic cases but as germline events, and it also appears as a rare allele in the African 1000 Genomes Project population in dbSNP (rs150447372). In addition, our dataset has enabled the identification of genes that have not yet been described as significantly mutated in BL, namely SIN3A, HIST1H1E, USP7, CHD8, and RFX7. Some of these novel genes carry out functions that are relevant to BL biology. Notably, SIN3A is a known antagonist of MYC activity58. Thus, it is a likely tumor suppressor gene, especially given its diffuse pattern of truncating mutations that are predicted to deactivate the protein. USP7 encodes a deubiquitinase that counteracts Mdm2-mediated ubiquitination and degradation of p5359. Mutations in USP7 are nearly all truncating, suggesting it is another tumor suppressor gene involved in BL. Only a single case houses mutations in both TP53 and USP7, indicating that mutations in USP7 potentially represent an alternative mechanism for abrogating apoptosis. Interestingly, the protein encoded by the EBV EBNA1 gene is known to disrupt the interaction between USP7 and p5360. Considering that mutations in TP53 and USP7 are significantly enriched in EBV-negative cases (Figure 10), our data supports a role for EBV in inhibiting p53-mediated apoptosis. Finally, HIST1H1E encodes a histone component, and CHD8 is involved in chromatin remodeling, contributing to the recurrent theme of epigenetic disruption in B-cell lymphomagenesis.

Figure 9: – Oncoprint plot showing putative driver mutations in significantly mutated genes (rows) across the BL cohort. Mutations are labeled according to their predicted consequence on the protein.
In an attempt to infer biological differences between BL subtypes, many previous studies have compared the mutation rates of various BL genes according to classification systems such as clinical variant status, EBV infection status, and more recently, EBV genome type. However, these studies were ill-equipped to address this question because of small cohort sizes and/or issues relating to RNA-seq somatic variant calls. On the other hand, our dataset is amenable for these types of analyses given its size and high-quality somatic variant calls. Indeed, we were able to identify a number of SMGs are significantly differentially mutated when comparing either endemic and sporadic cases or EBV-positive and -negative cases (BH-adjusted P-value < 0.1, Fisher’s exact test). However, the only differences that survive multiple test correction are based on EBV infection status. In all cases, the genes are more commonly mutated in EBV-negative tumours: SMARCA4, ID3, CCND3, and TP53 (with and without USP7). This is liekly the driving force between the significant difference in the number of putative driver mutations according to EBV infection status presented earlier (Figure 8). We did not identify any difference in gene-wise mutation rates between EBV type 1 and EBV type 2, which departs from what has been previously reported22.
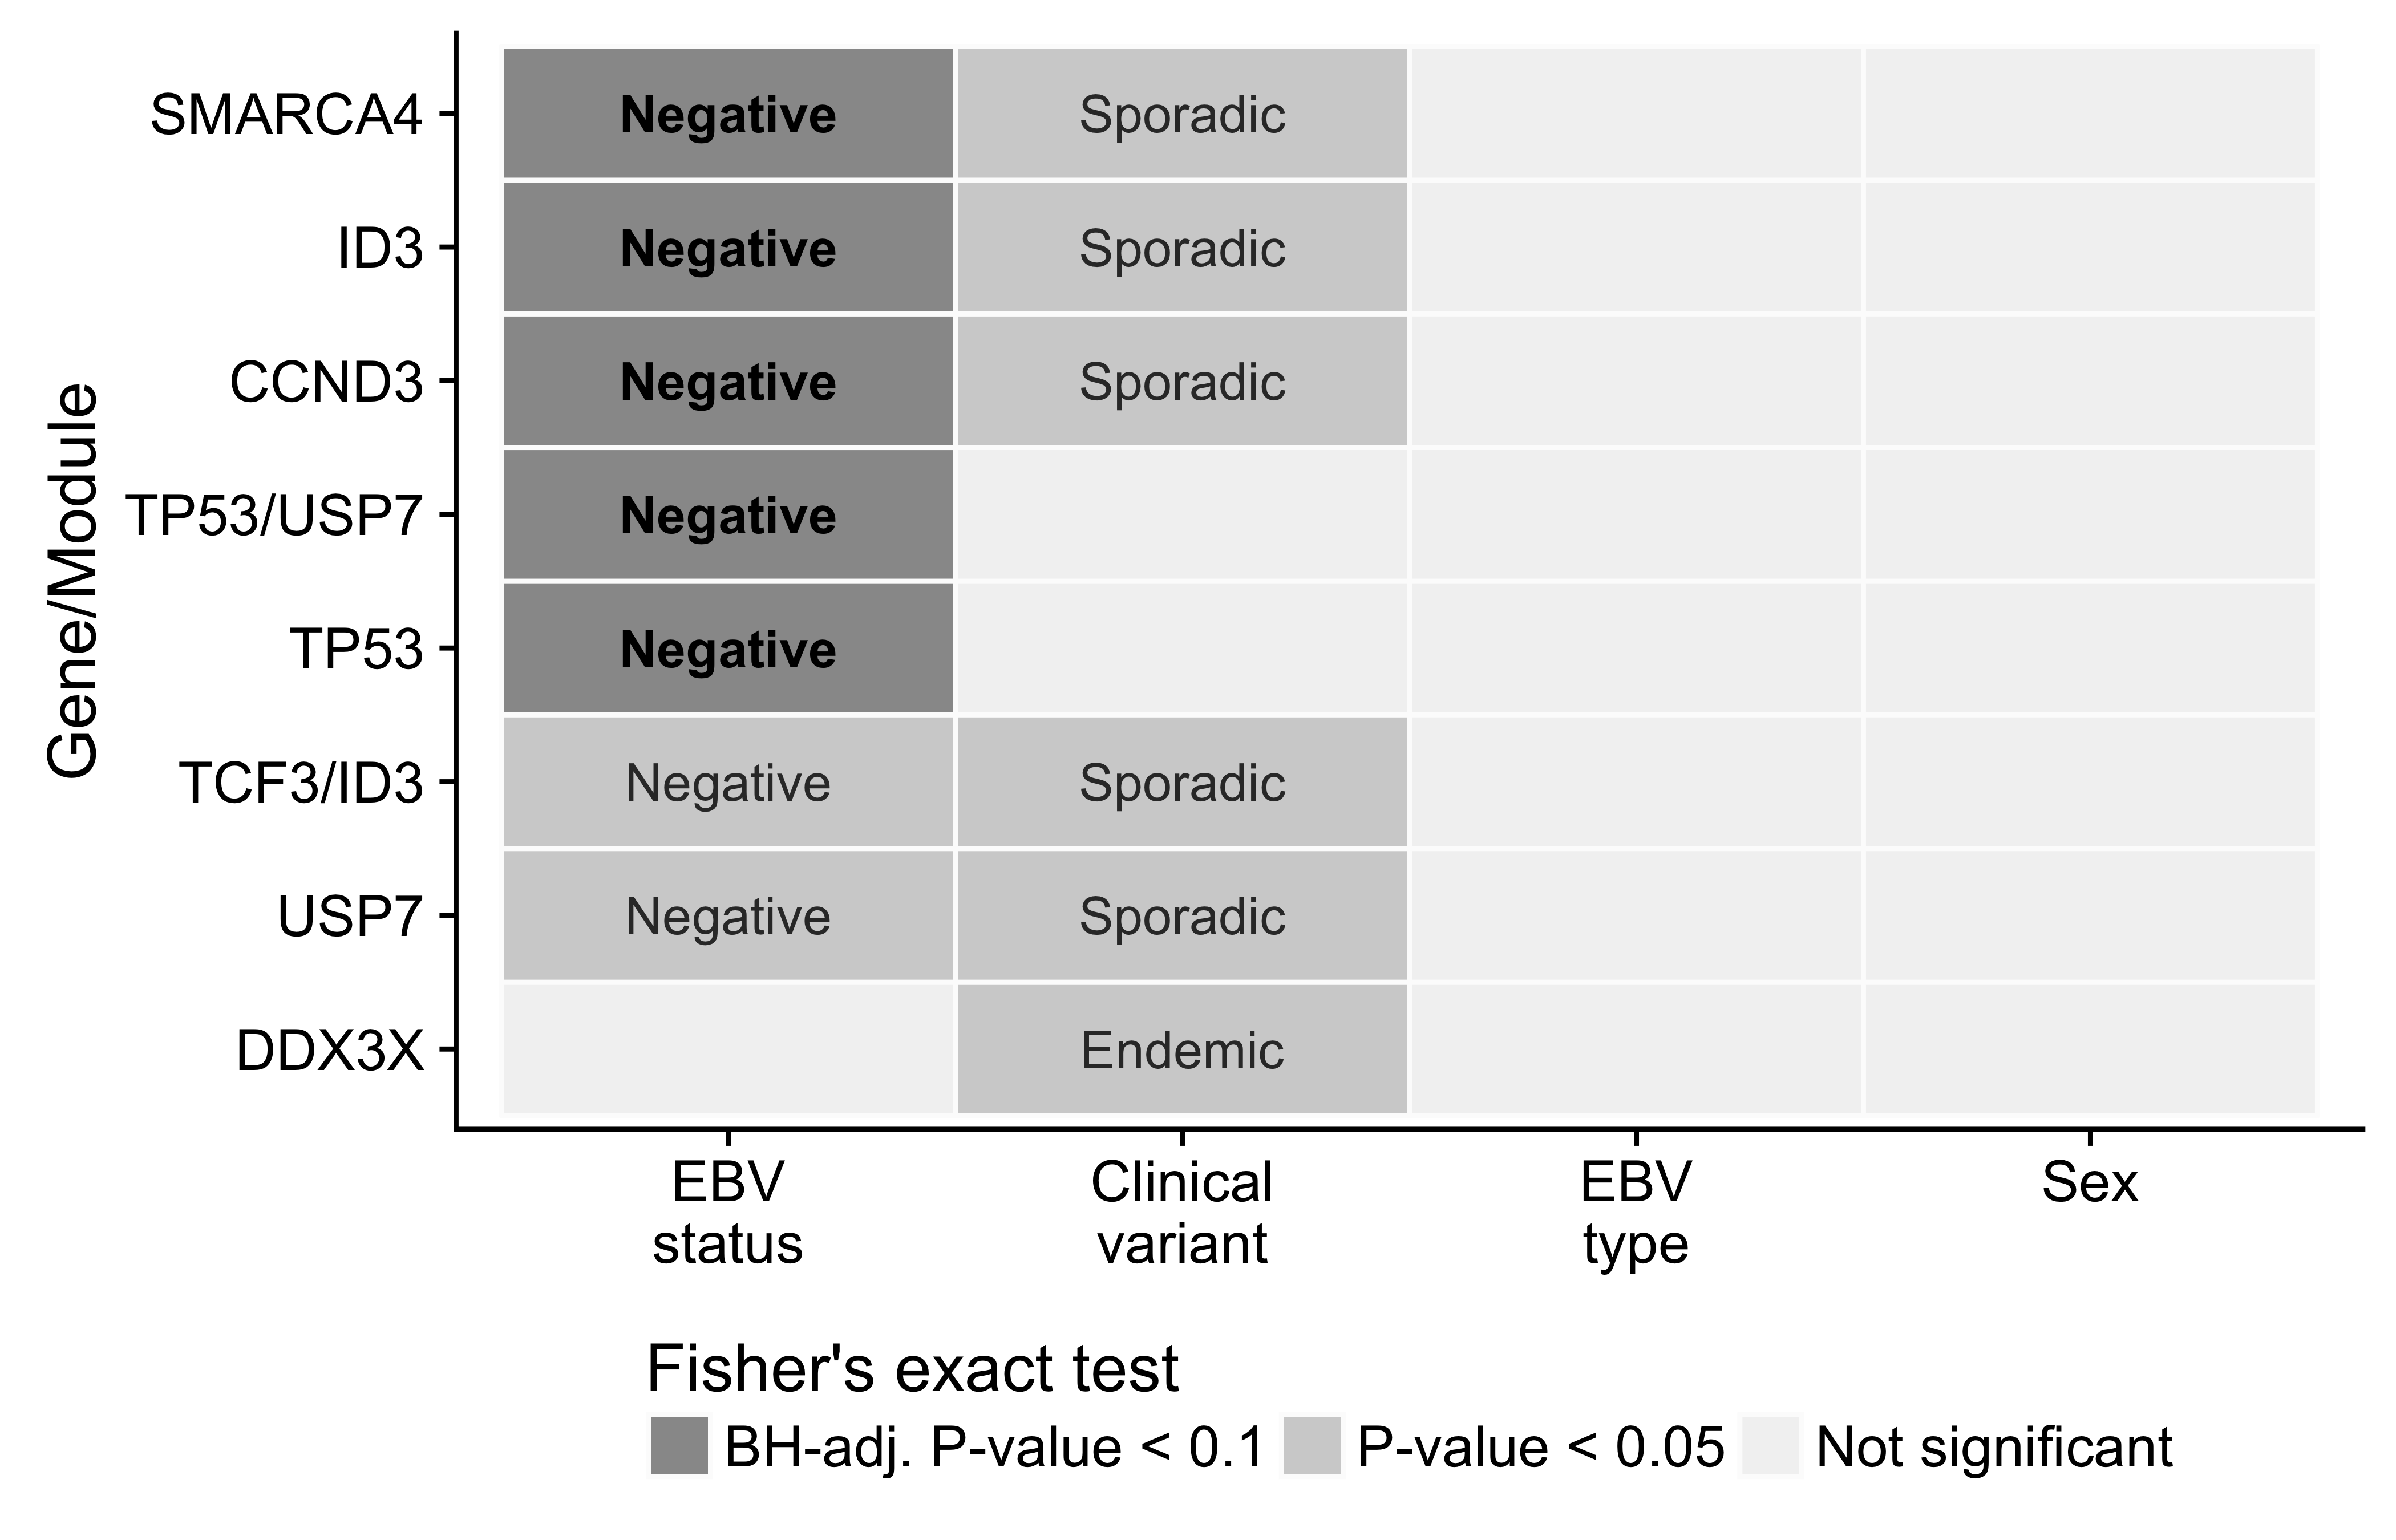
Figure 10: – Differential mutation rates among significantly mutated genes in BL. Only showing genes with a significant differences according to at least one classification system. The labels indicate the subtype in which mutations are more common.
Summary and Future Directions
The BLGSP is an ongoing international collaborative project aimed at providing a comprehensive molecular portrait of BL across all subtypes. Here, we identify novel candidate coding and non-coding driver mutations, nominating compelling targets for therapy. Perhaps the most promising candidate is USP7 given the putative role of mutations in this gene in abrogating apoptosis. We hypothesize that Mdm2 inhibitors may trigger synthetic lethality in USP7-mutated, TP53-wildtype tumors. In fact, others have shown that several BL cell lines are sensitive to Mdm2 antagonists such as nutlin-361. While only 7 cases (6.7%) are affected by USP7 mutations, the enrichment of mutations in TP53 and USP7 among EBV-negative cases raises the possibility that all EBV-positive, TP53-wildtype cases could be treated using the same strategy. In this work, we also highlight several molecular differences between BL subtypes and show that classifying according to EBV infection status has a firmer basis in biology. This is supported by differences in AID-mediated aberrant SHM, AID expression, germinal center cell-of-origin, and genome-wide and gene-wise mutation rates. These findings put into question the current classification system that relies on geographic origin by showing that there are more similarities between cases that are EBV-positive, regardless of where they arise.
Going forward, this project will continue to sequence additional BL cases, with a focus on adult and HIV-positive patients. This will allow us to deepen our understanding on the differences between pediatric and adult BL, if there are any, as well as attempt to delineate the role for HIV infection in promoting BL formation. Given the increasing fraction of tumor samples being derived from formalin-fixed, parafin-embedded (FFPE) tissue, the project also sequenced the paired fresh frozen (FF) and FFPE tissues from 35 tumors. If I consider the FF data as ground truth, this data will allow me to better characterize FFPE artifacts in somatic mutation calls as well as in gene expression data. To address this, I plan on leveraging machine learning methods to identify features that discriminate between real variants (i.e. found in FF sample) and FFPE artifacts. I will also explore different methods for correcting the difference between the expression profiles from FF and FFPE tissues for the same underlying sample. Currently, my timeline for defending my PhD thesis is 1.5 years.
Page break
Supplementary Material
Supplementary Figures
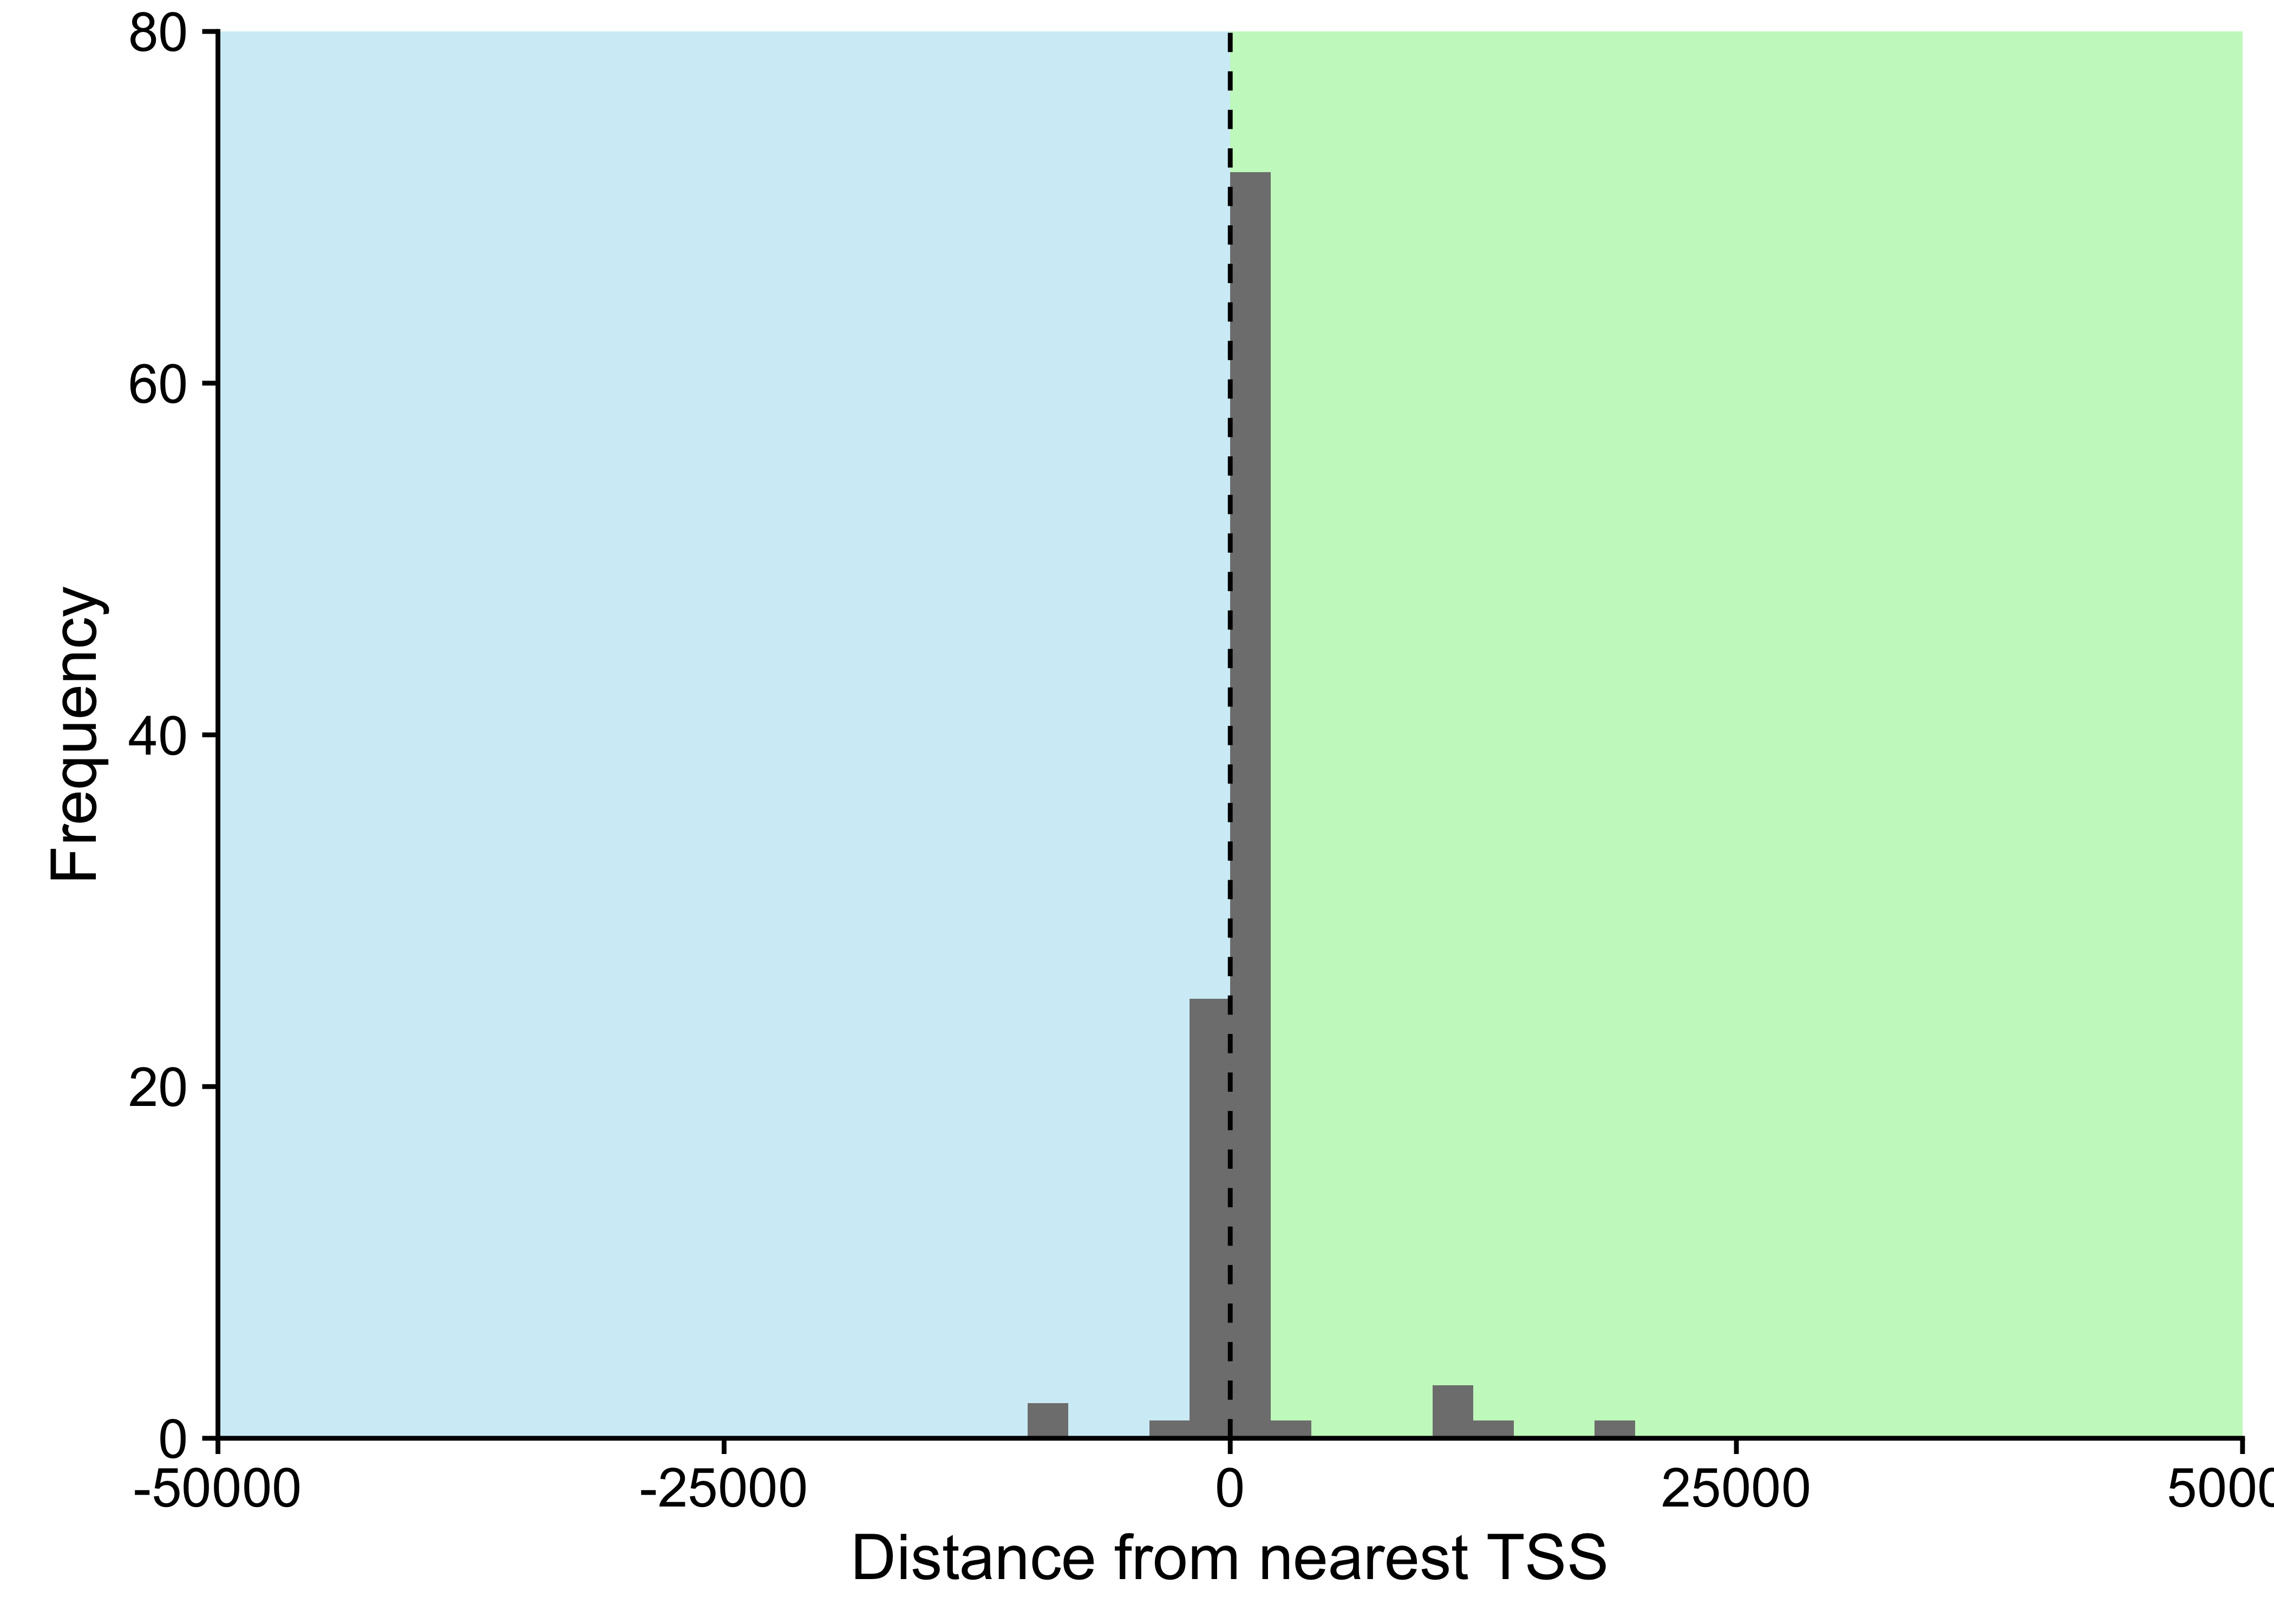
Figure 11: – Distance between cluster of non-coding mutations and nearest transcription start site (TSS). Only considering clusters within 50000 bp of a TSS, representing 98% of all clusters.
Page break
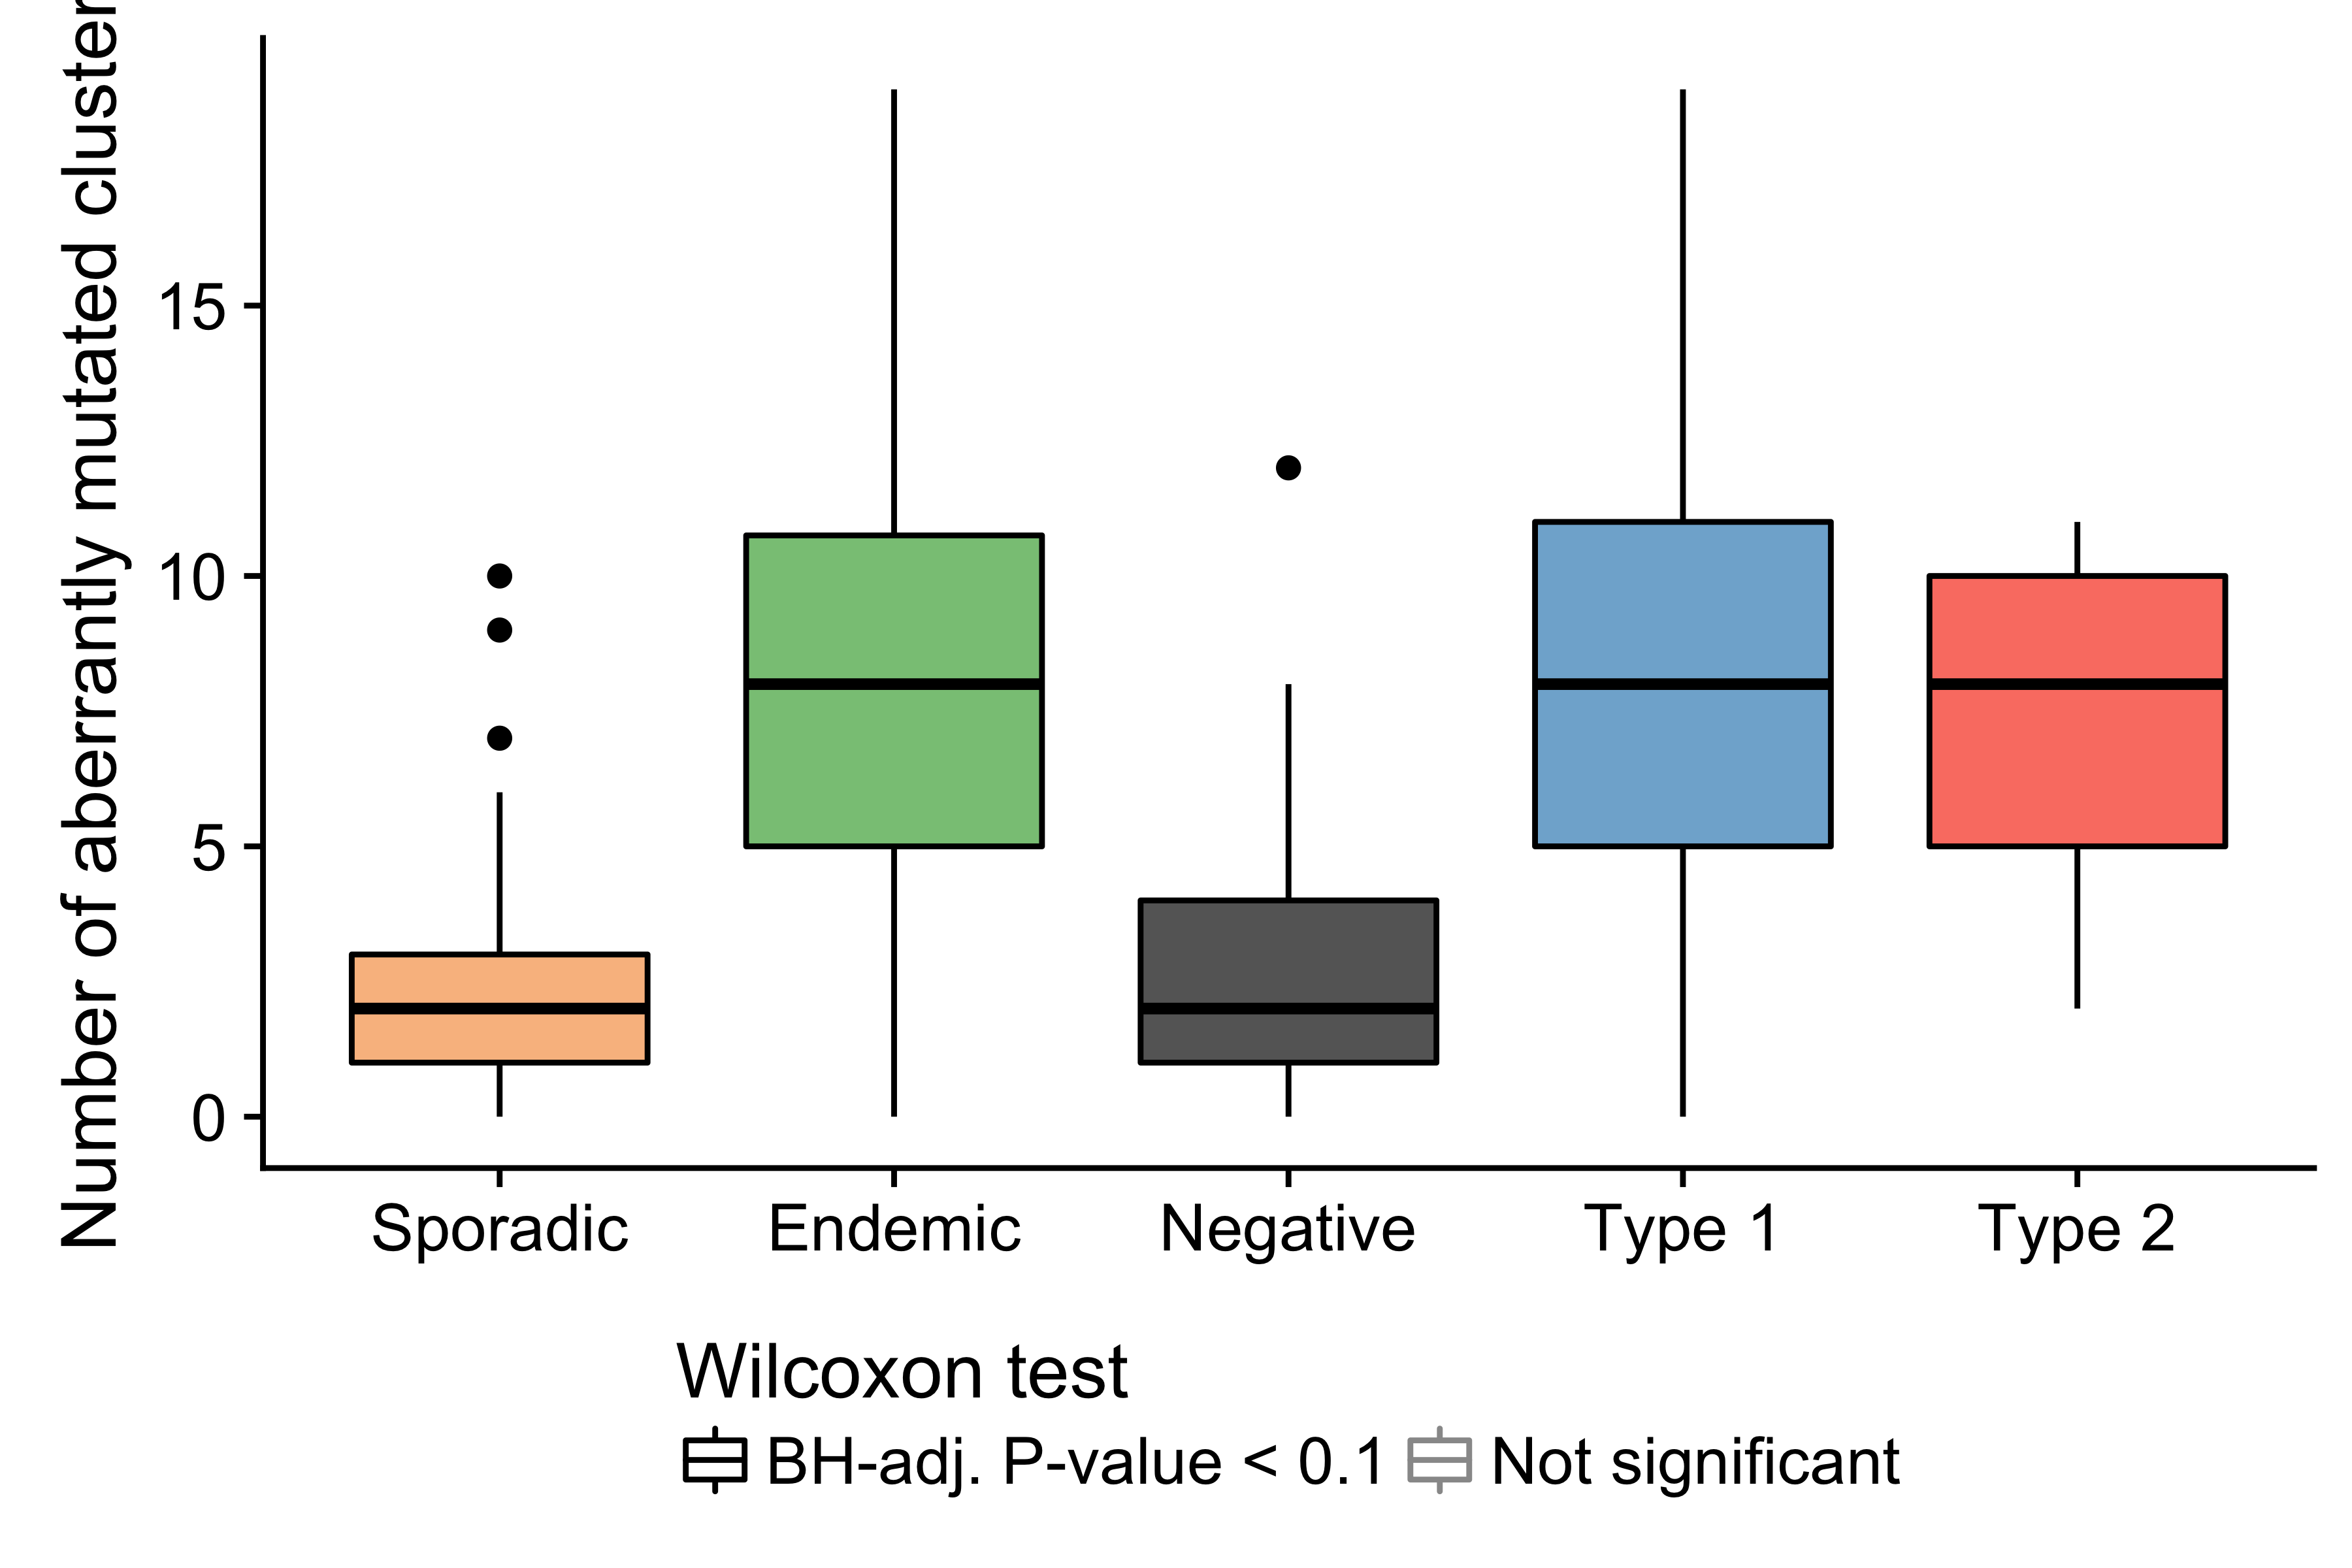
Figure 12: – Number of mutated clusters of non-coding mutations per sample according to clinical variant or EBV infection status. Physiologic targets of SHM consist of the immunoglobulin genes and MYC.
Page break
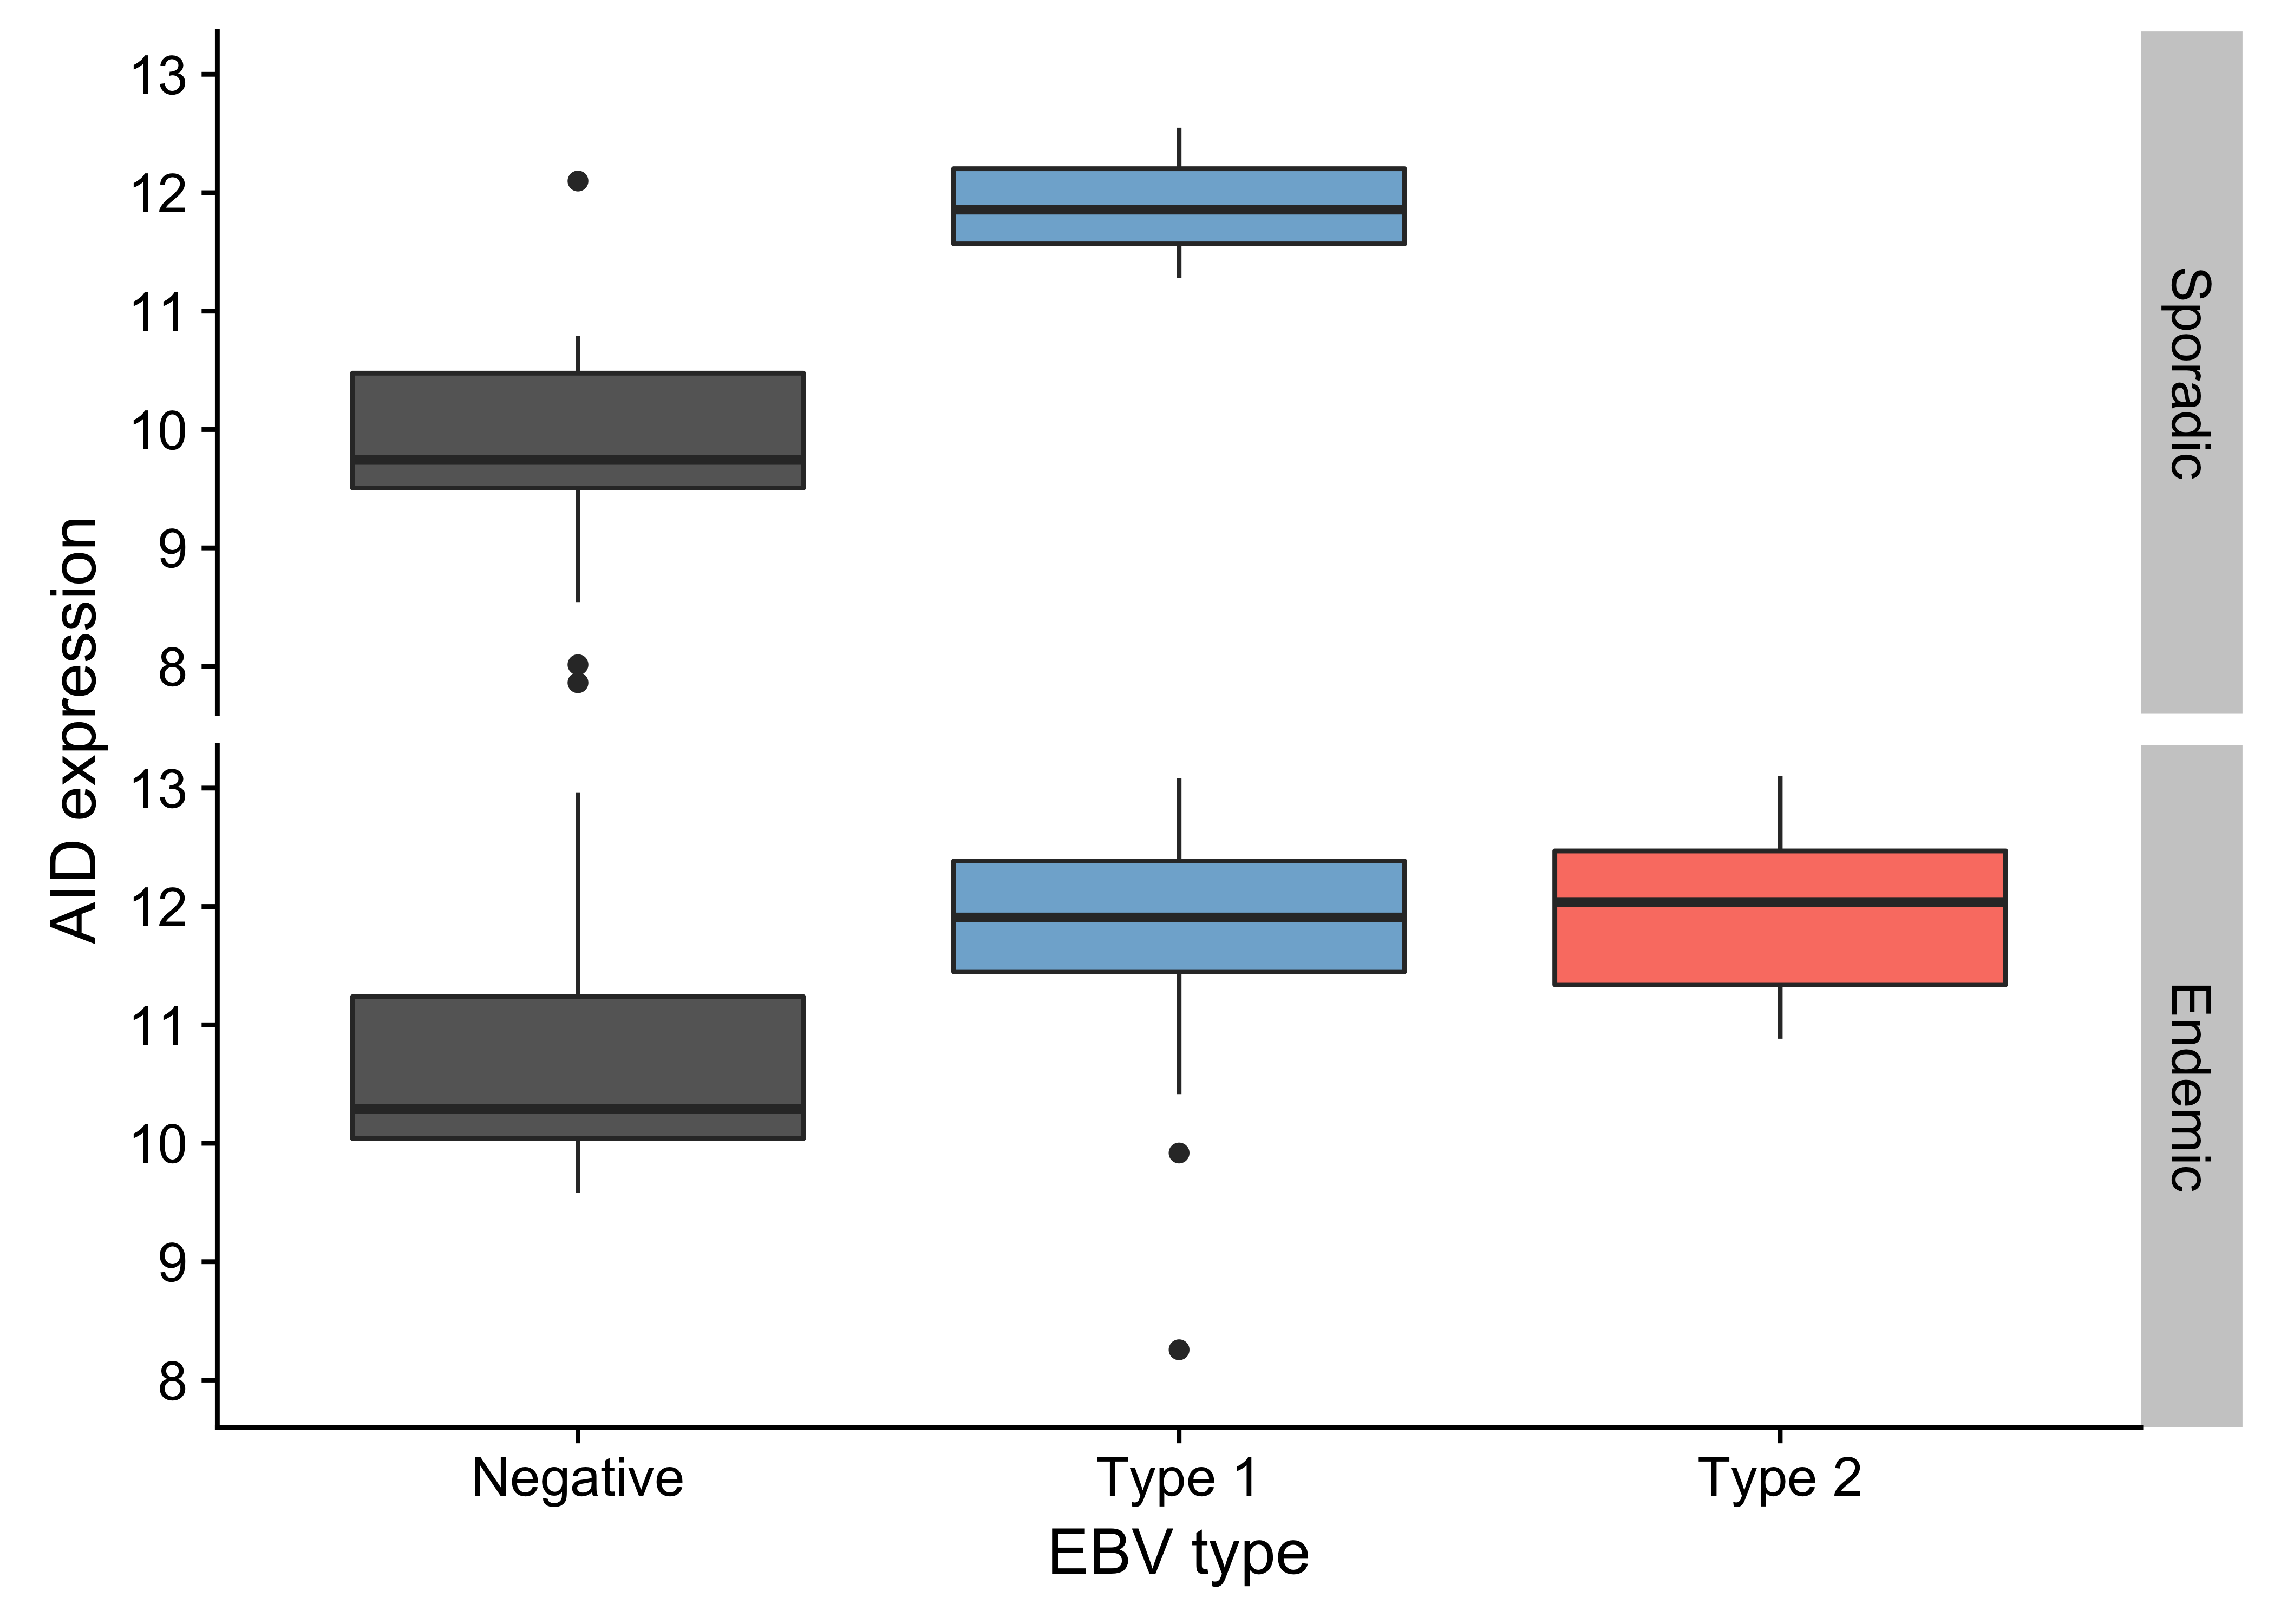
Figure 13: – Box plots showing higher AID expression in EBV-positive cases regardless of geographic origin (endemic or sporadic).
Page break
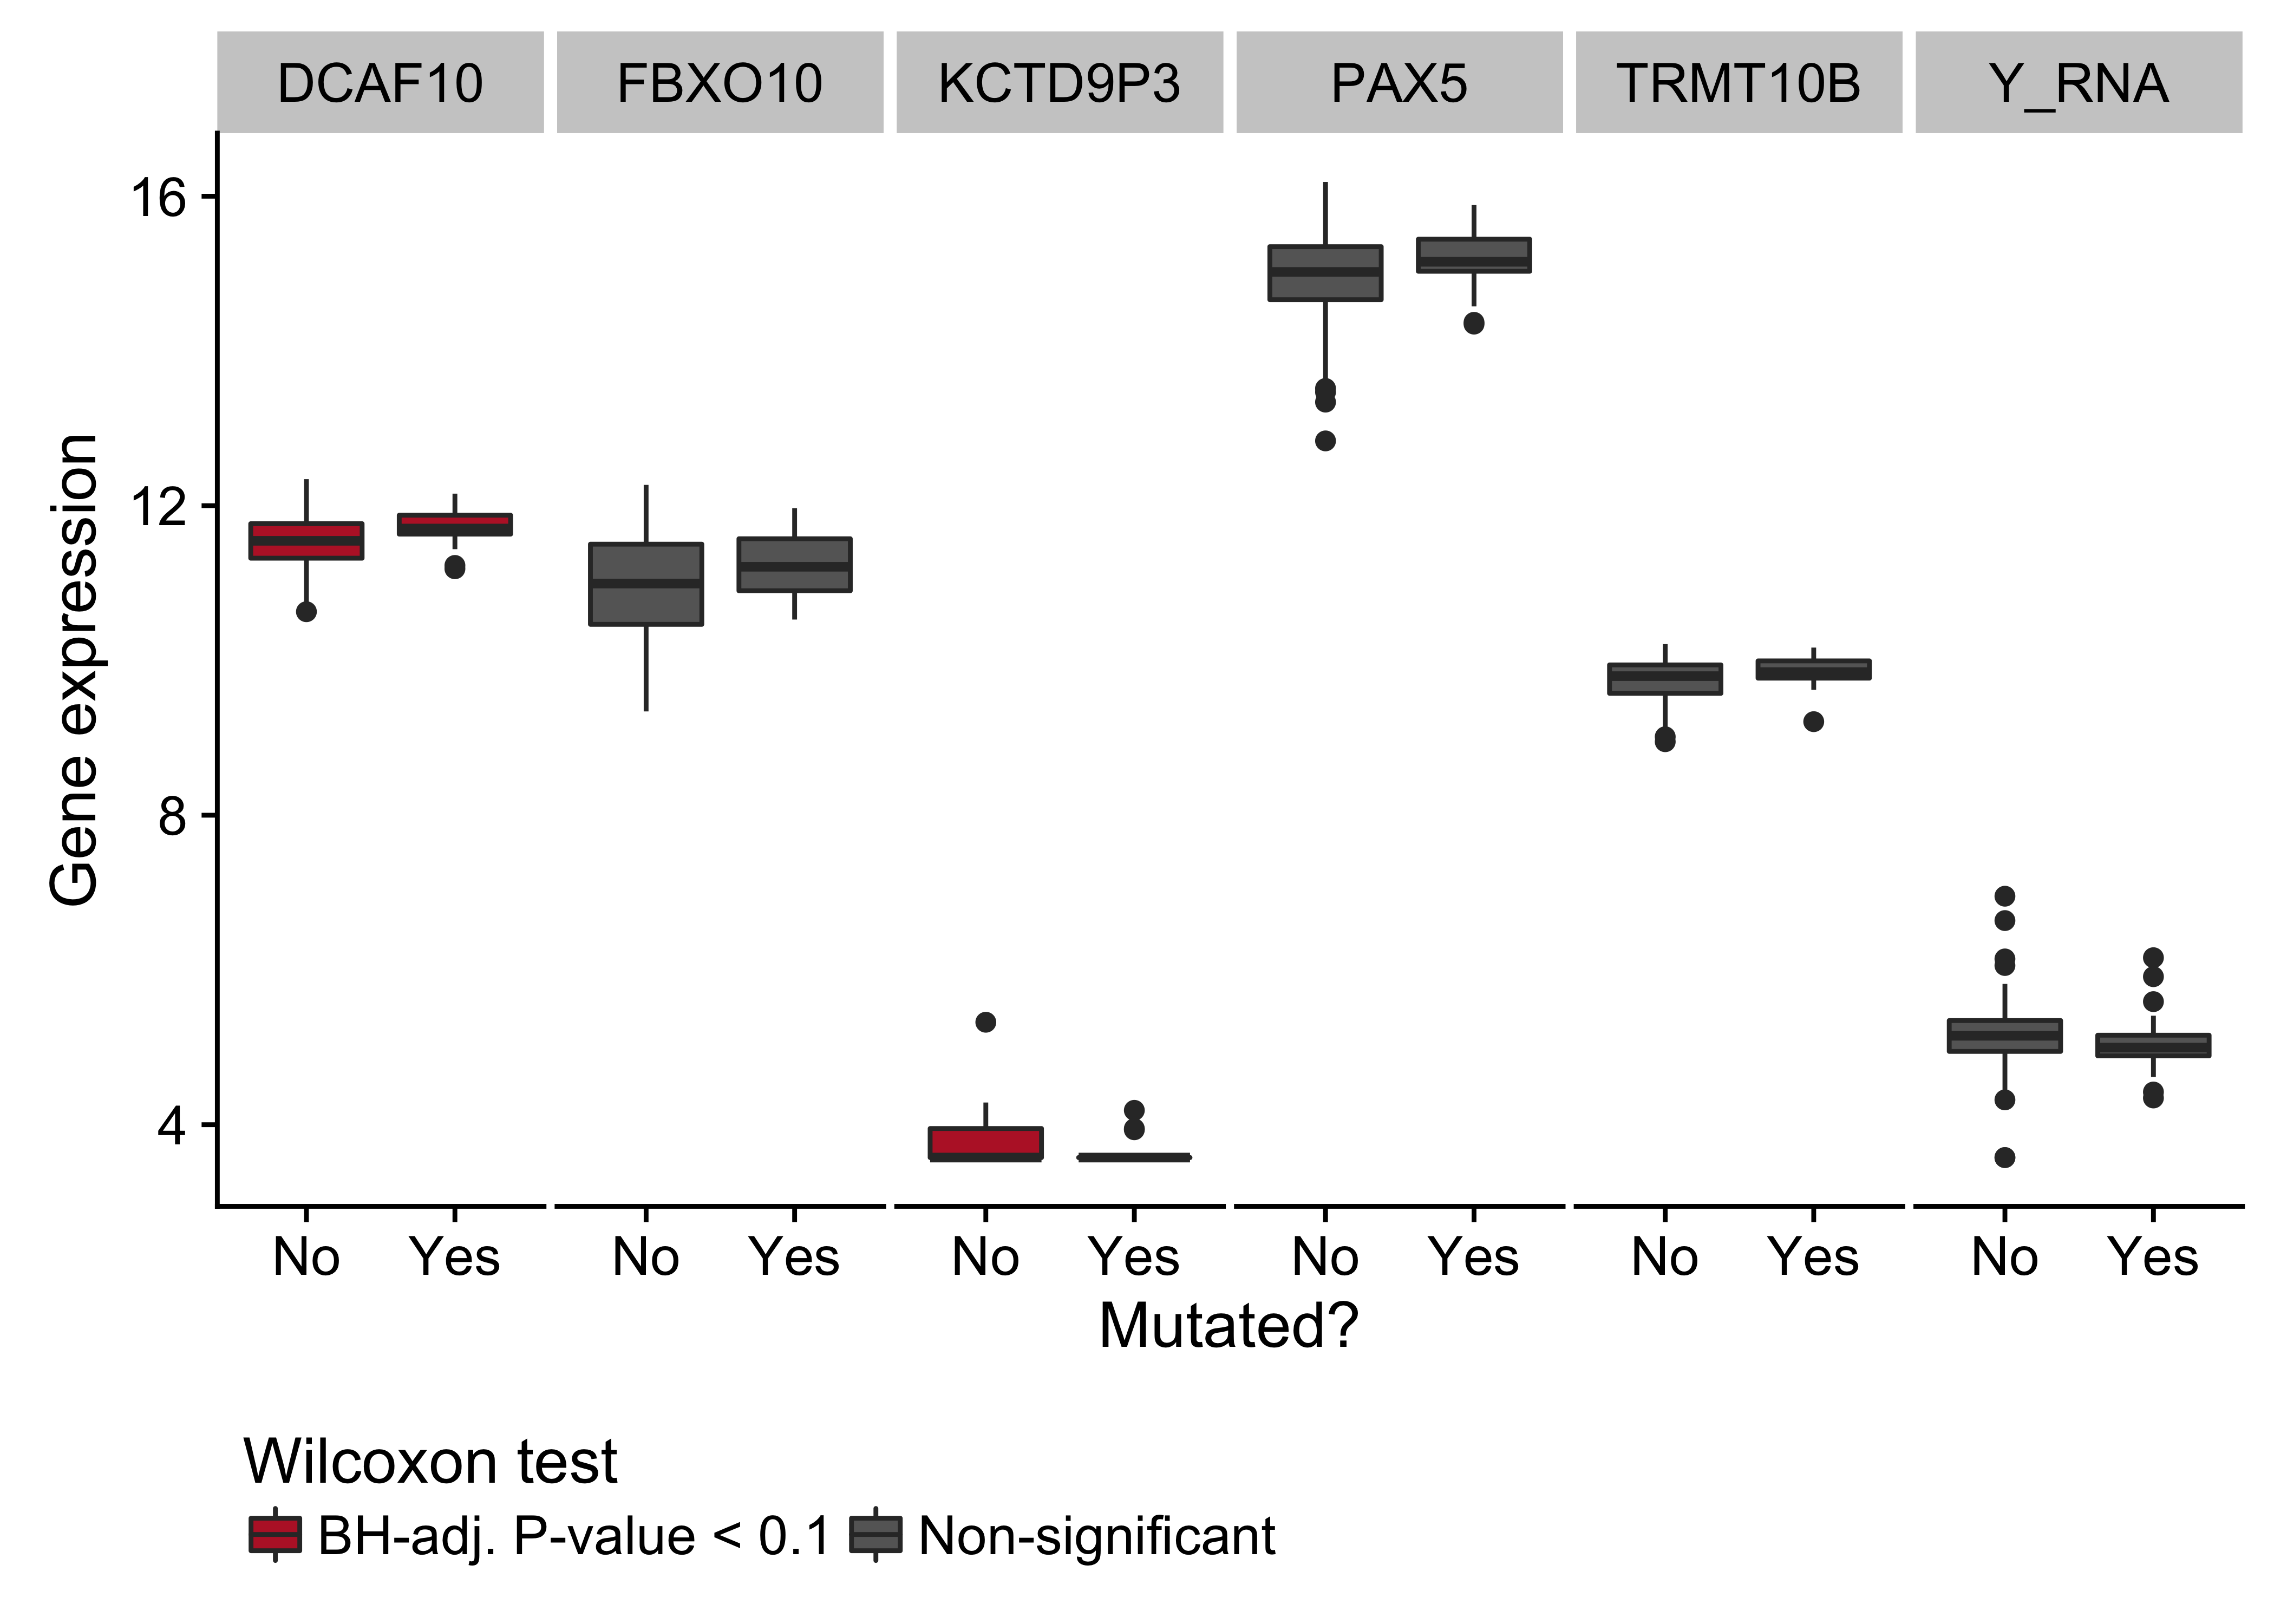
Figure 14: – Box plots showing expression of genes near the cluster of non-coding mutations that overlaps a PAX5 enhancer as a function of its mutation status. Box plots highlighted in red are significantly differentially expressed (Wilcoxon test).
Page break
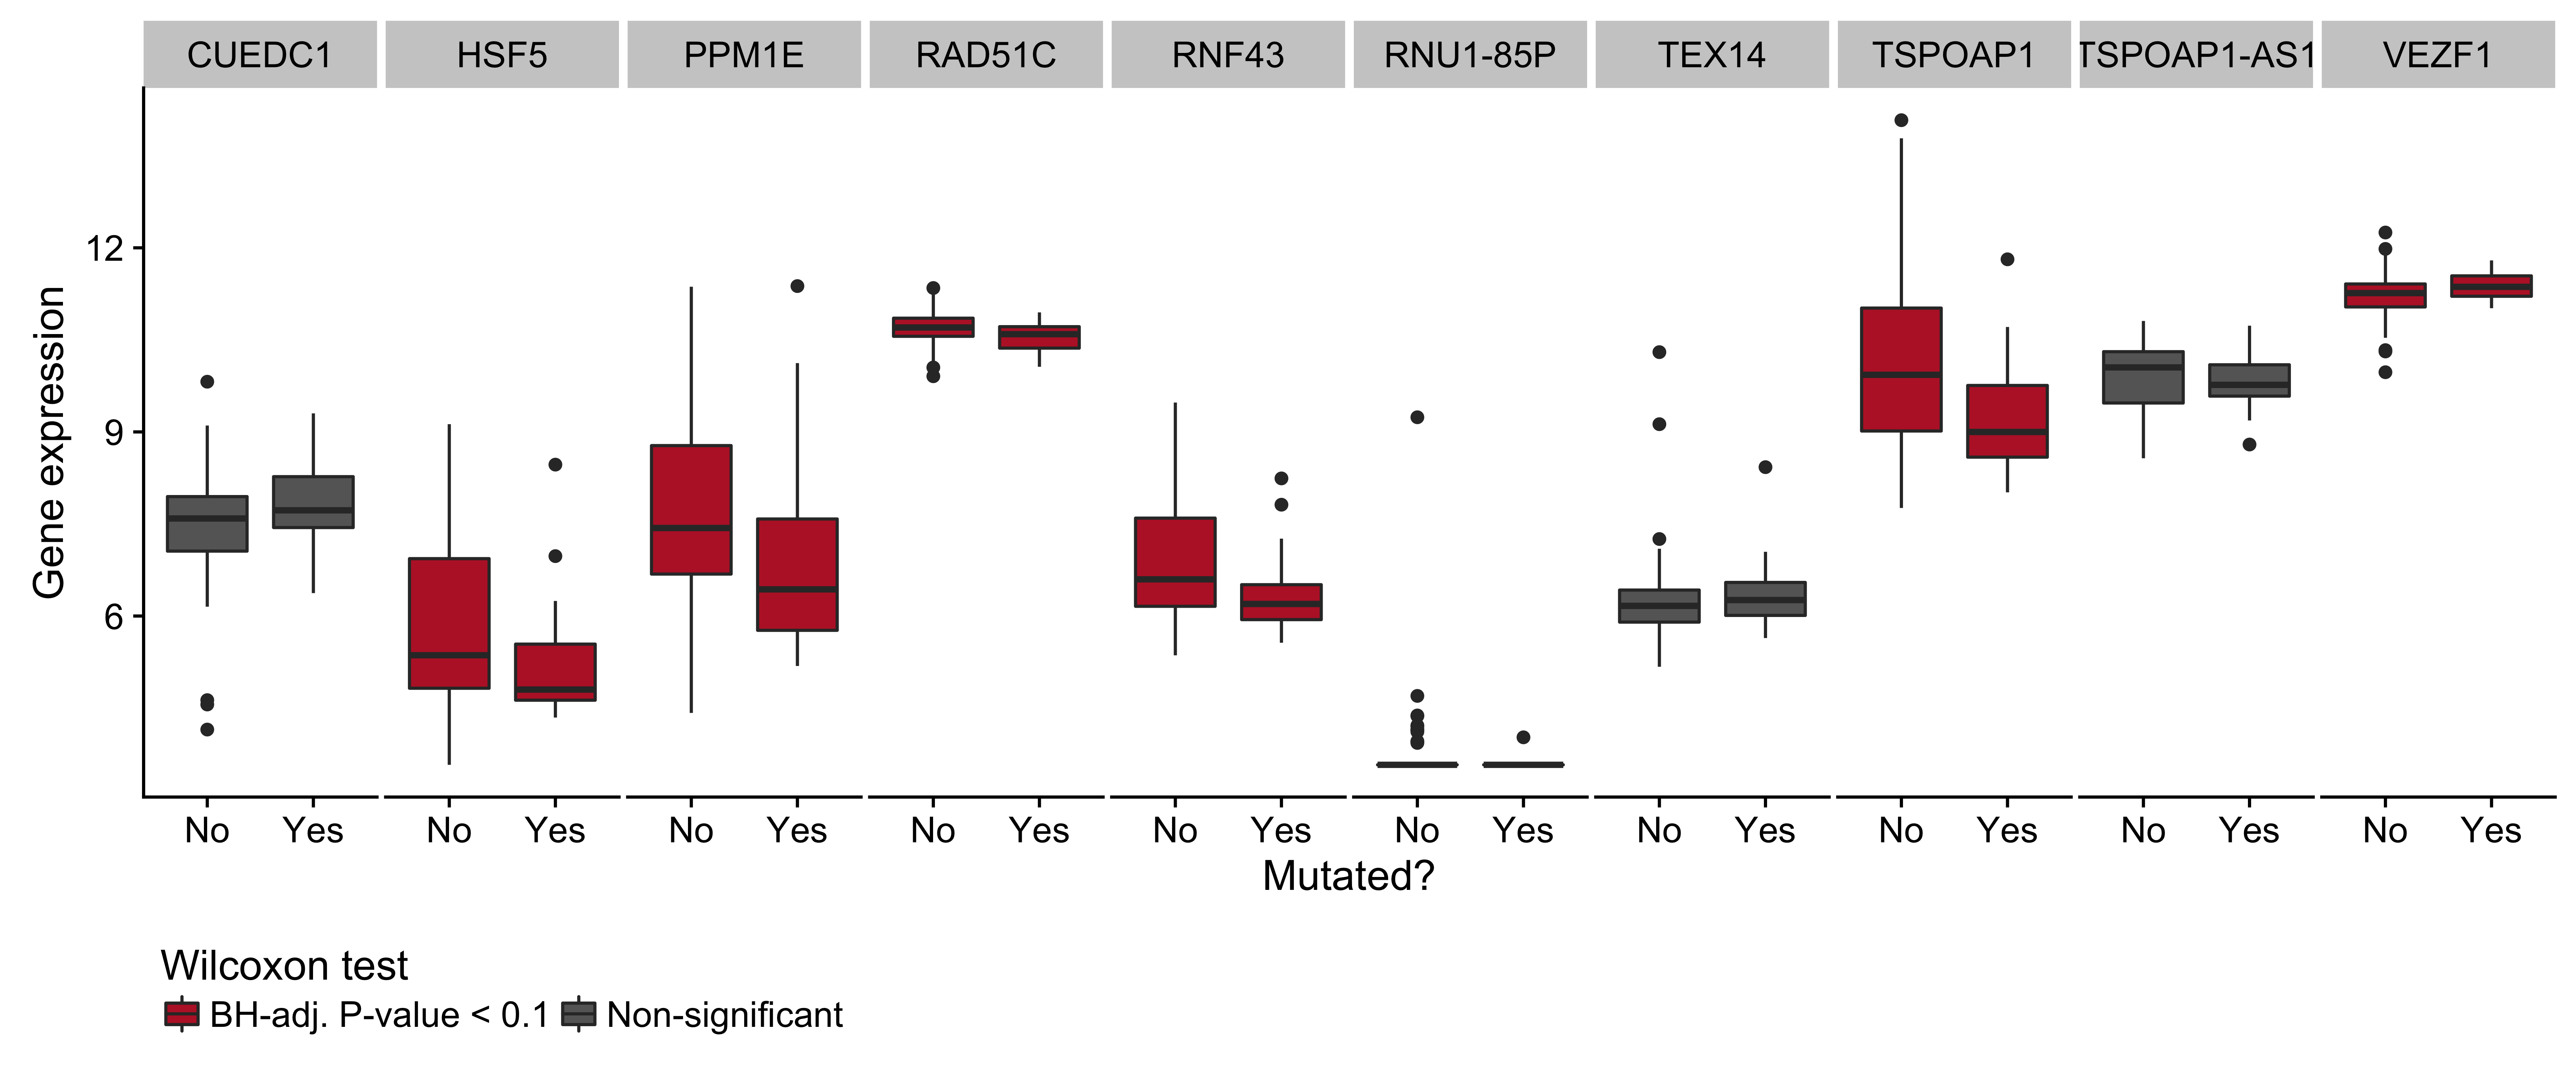
Figure 15: – Box plots showing expression of genes near the cluster of non-coding mutations that overlaps miR-142 as a function of its mutation status. Box plots highlighted in red are significantly differentially expressed (Wilcoxon test).
Page break
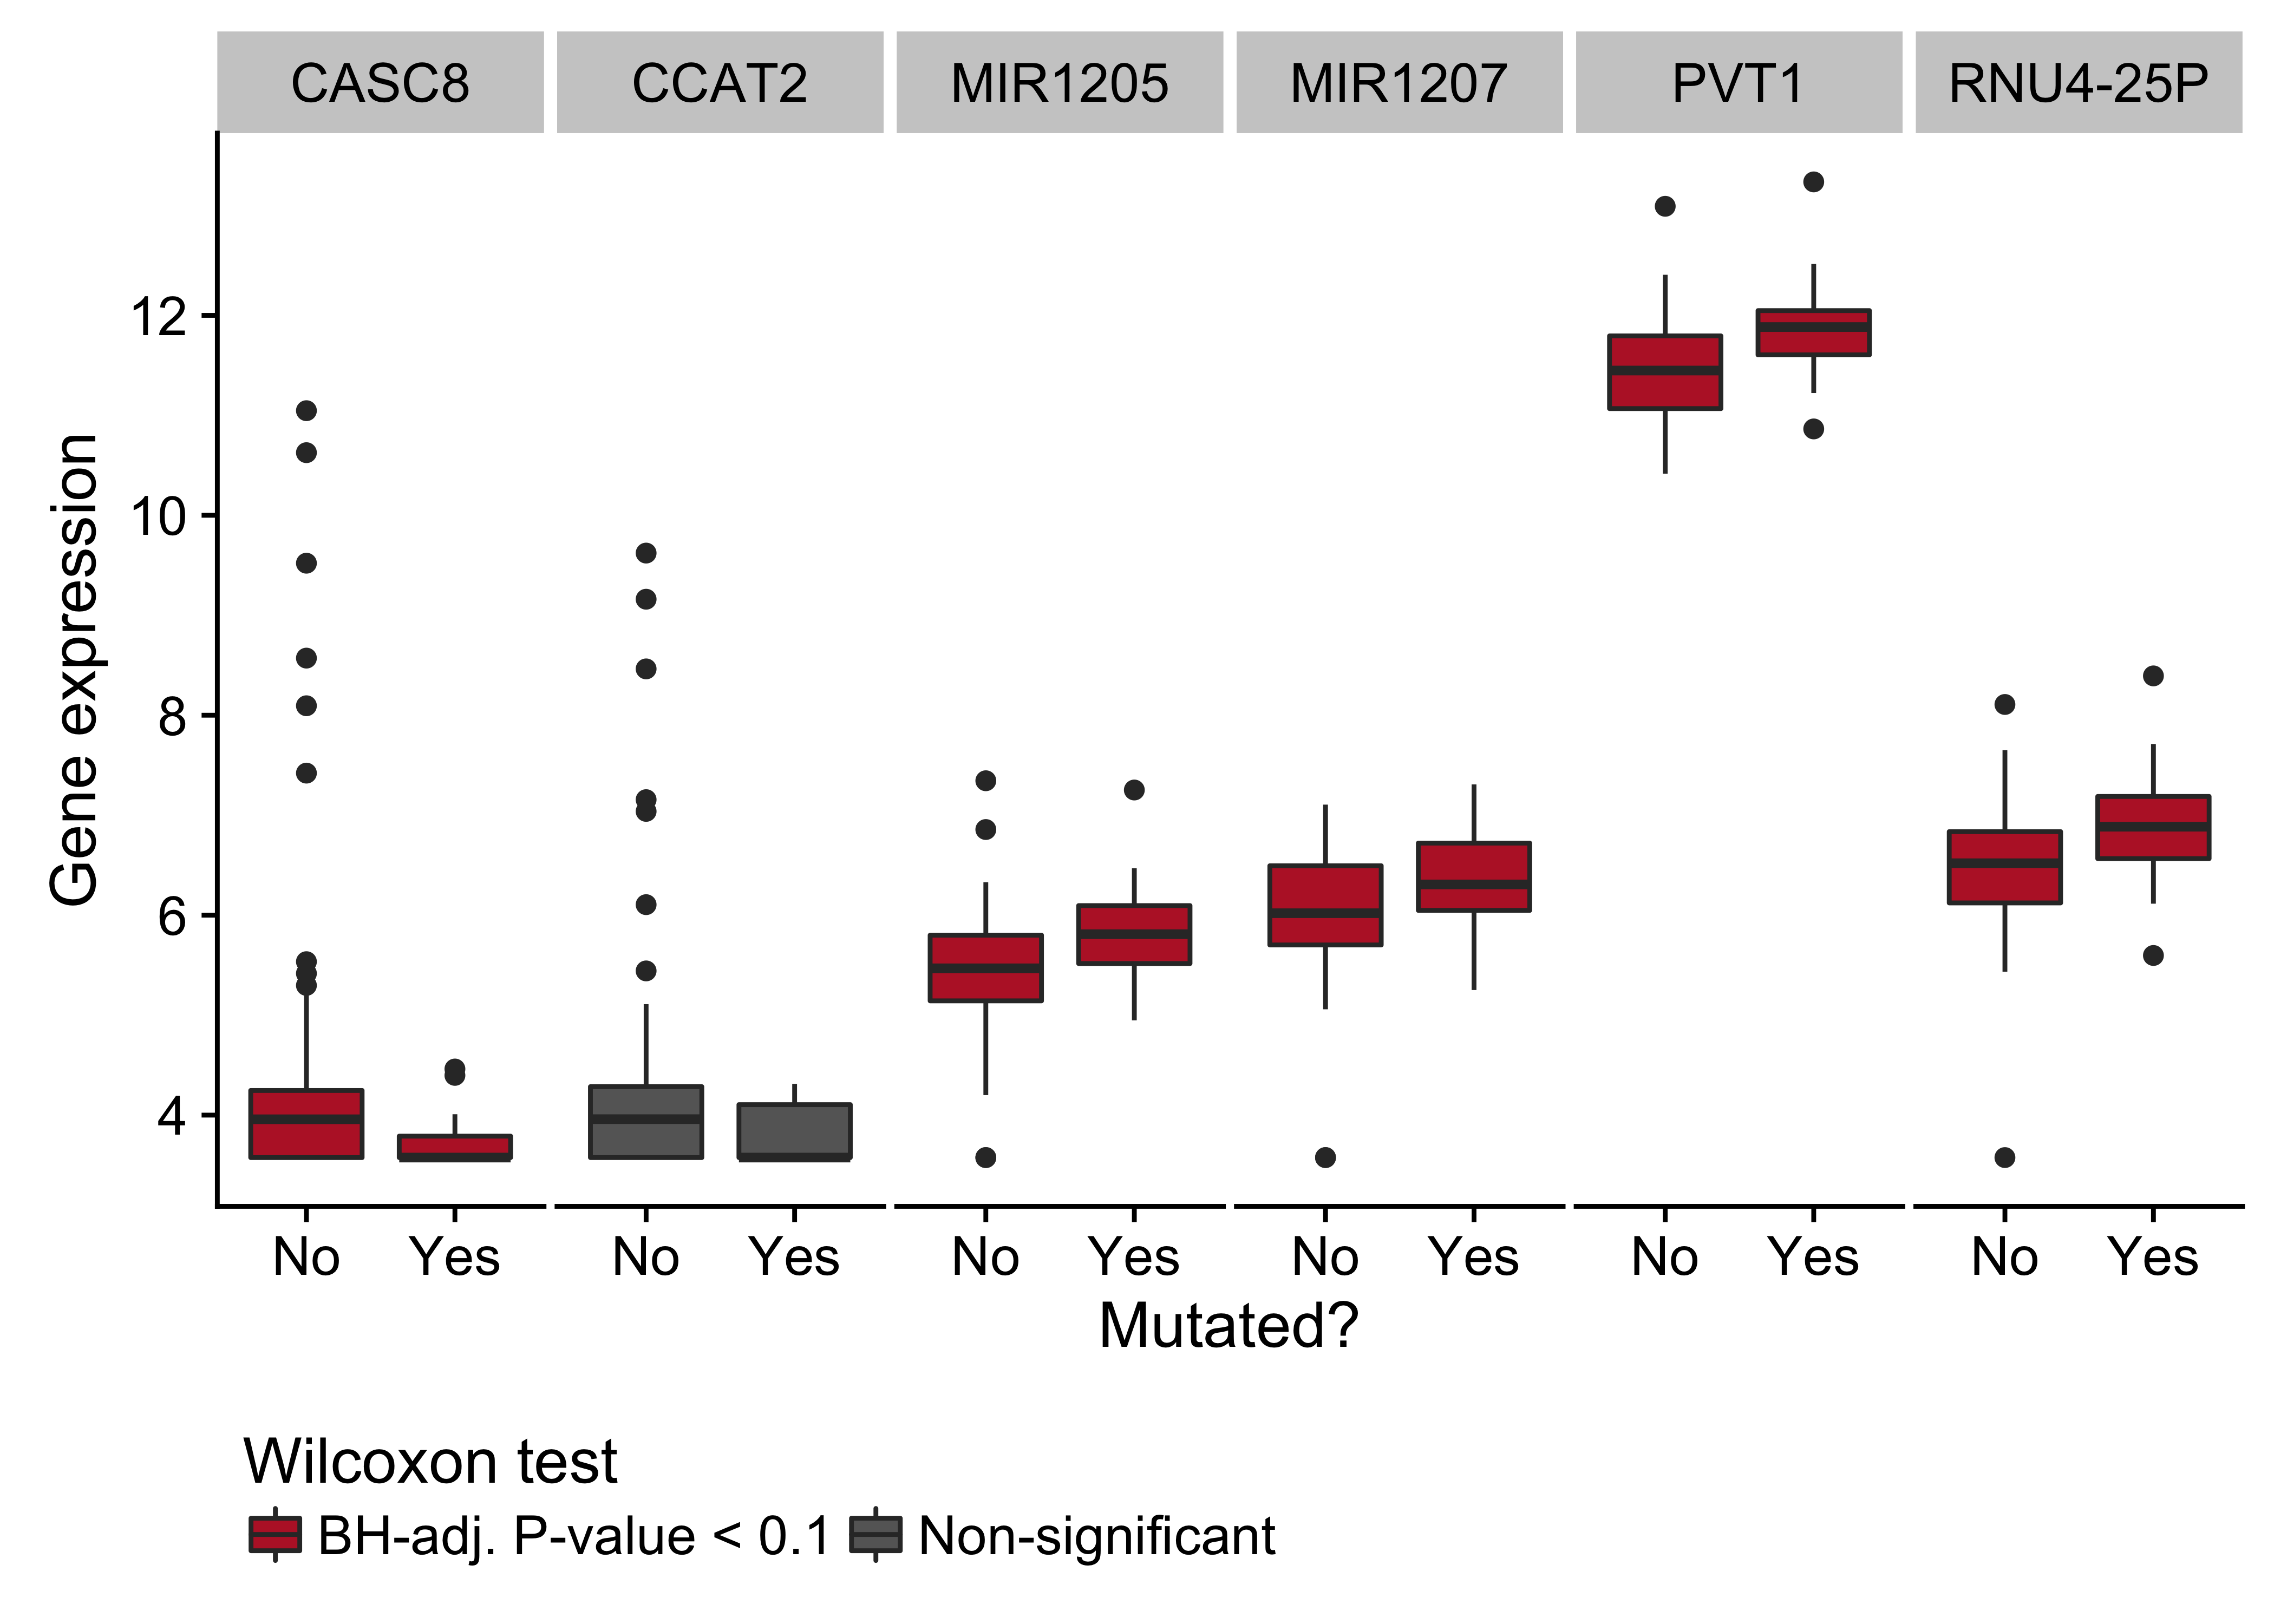
Figure 16: – Box plots showing expression of genes near the cluster of non-coding mutations that overlaps the PVT1 promoter region as a function of its mutation status. Box plots highlighted in red are significantly differentially expressed (Wilcoxon test).
Page break
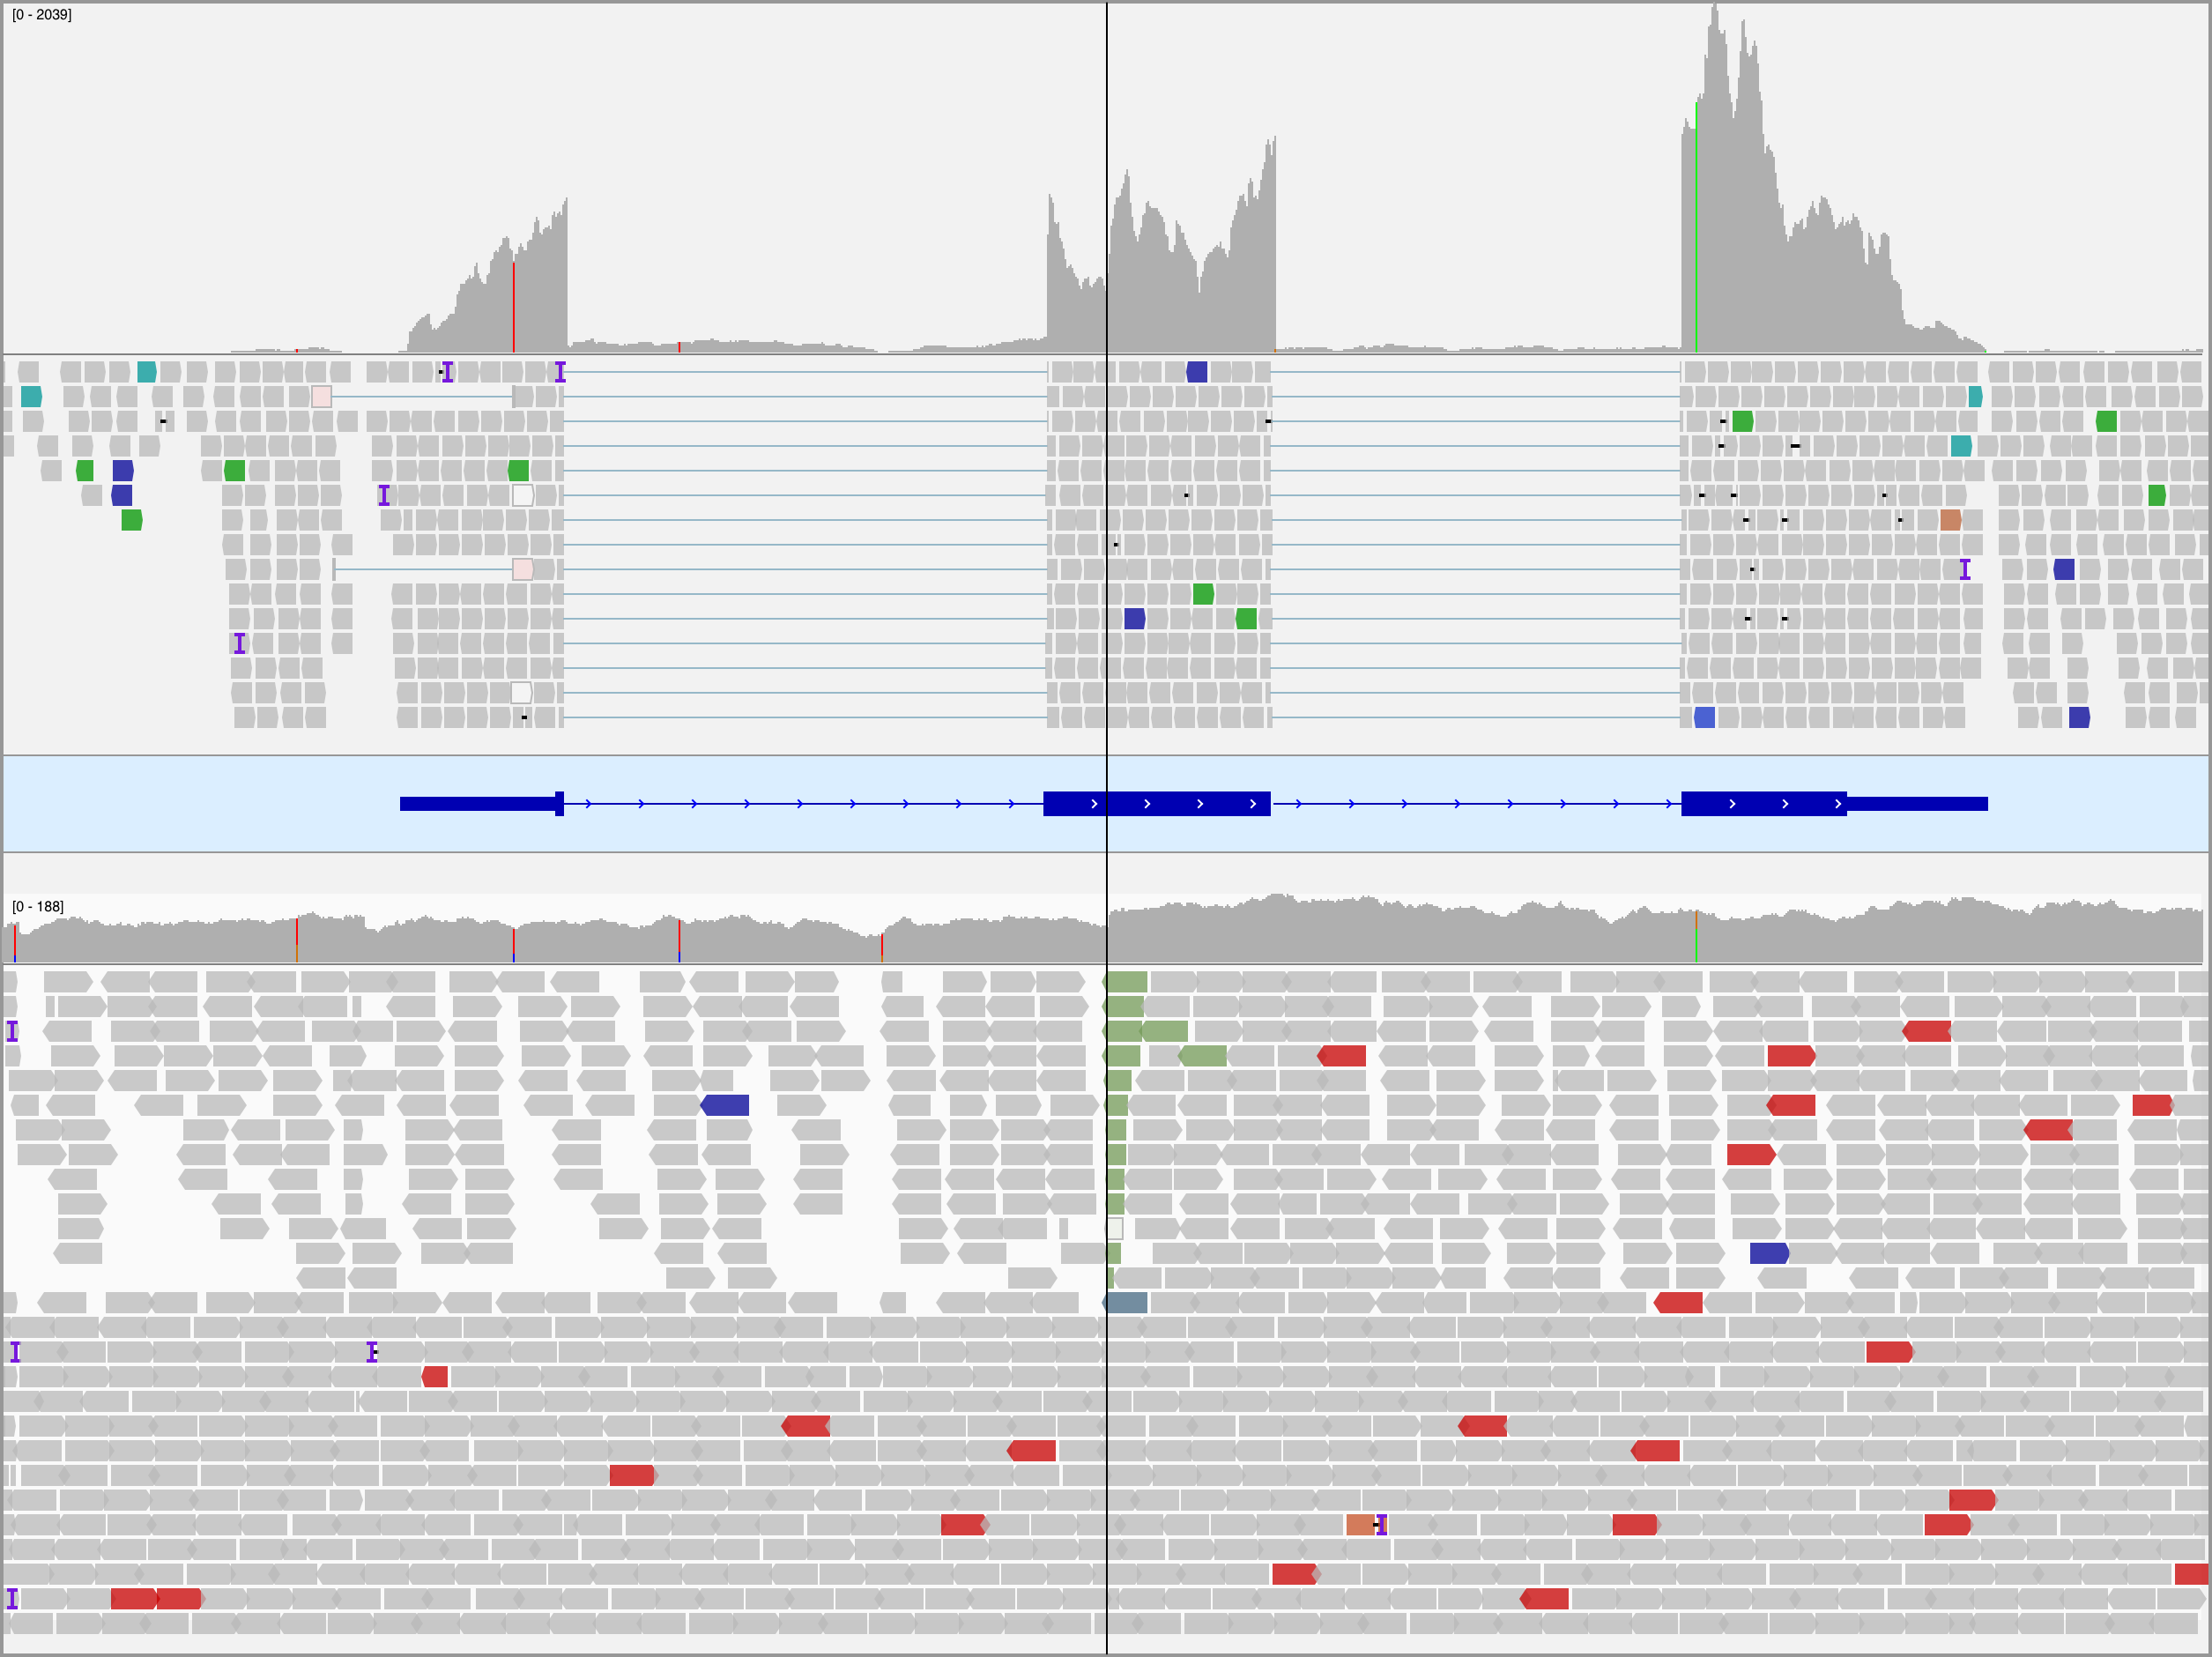
Figure 17: – – Integrative Genomics Viewer (IGV) screenshot of tumor RNA-seq (top panel) and WGS (bottom panel) data for BL123 showing the translocation in MYC at codon 79. The center line indicates the location of the breakpoint. The reads in the bottom track are sorted by the chromosome of the mate to emphasize the breakpoint. Note the increase in coverage in the RNA-seq data following the breakpoint.
Page break
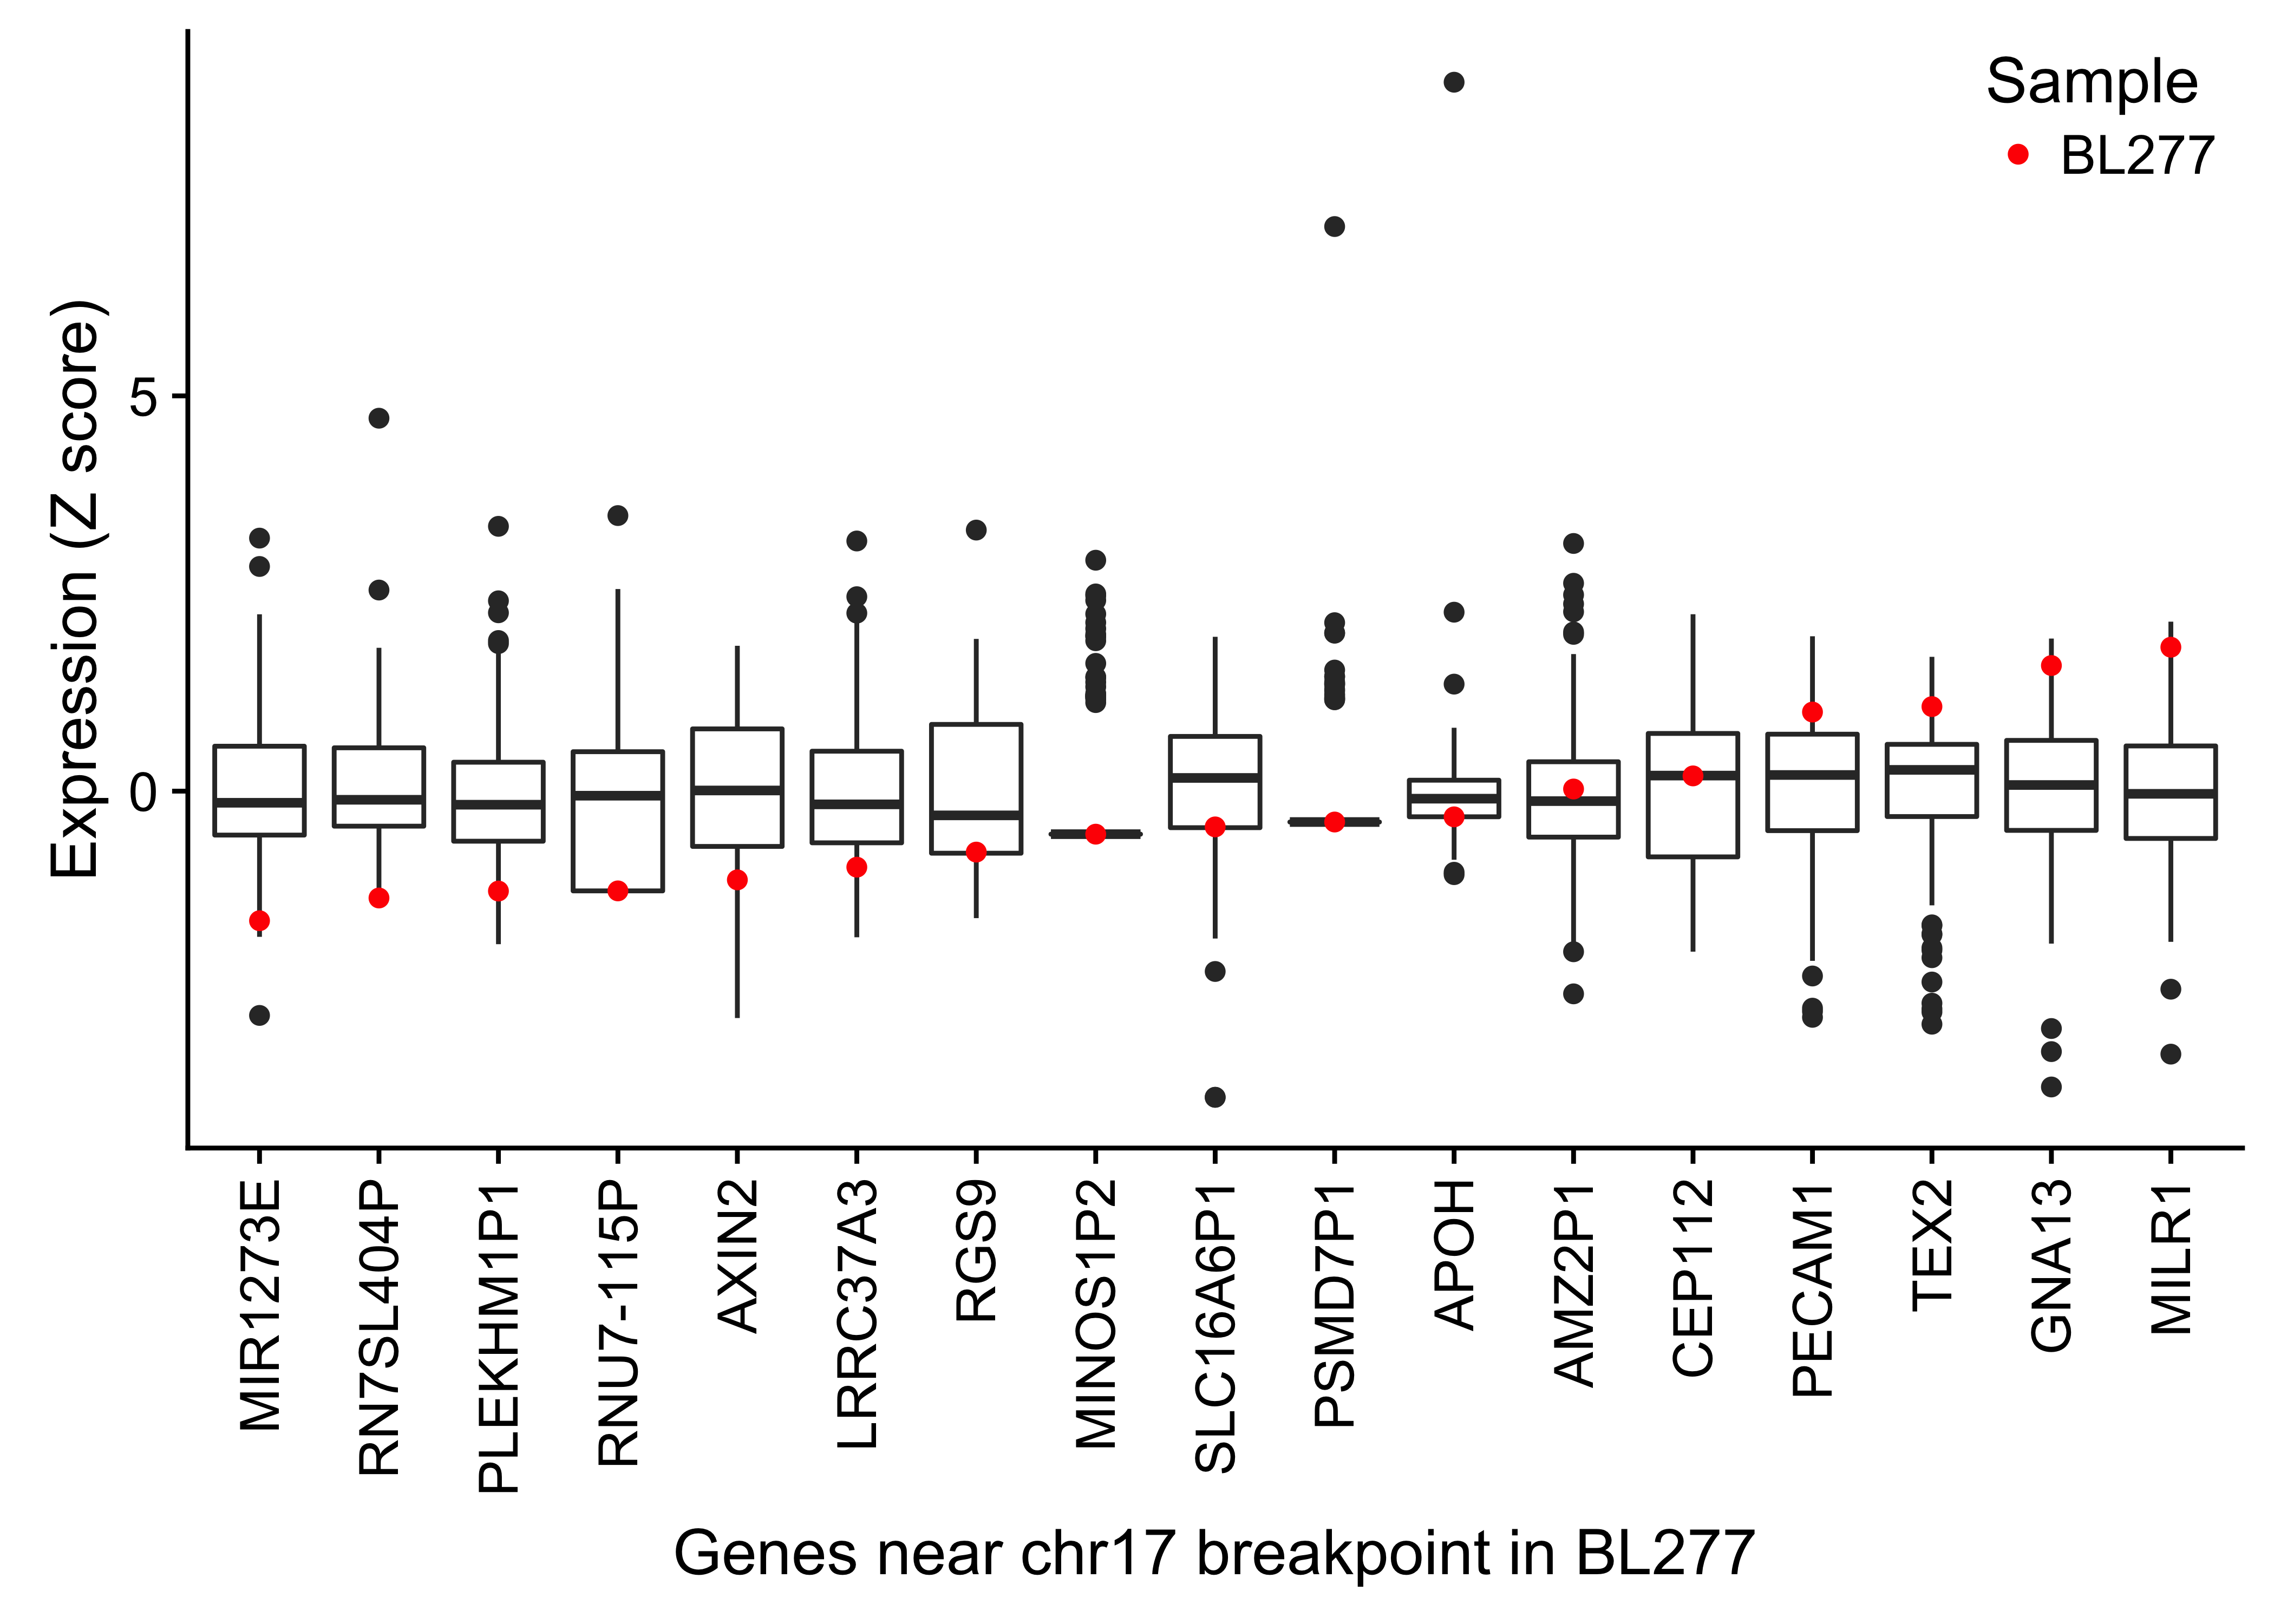
Figure 18: – Box plots showing the expression (Z score) of genes within 1 Mb of the chr17 breakpoint in BL277 involving with IGH and MYC. The highlighted points in red display the gene expression in BL277.
Page break
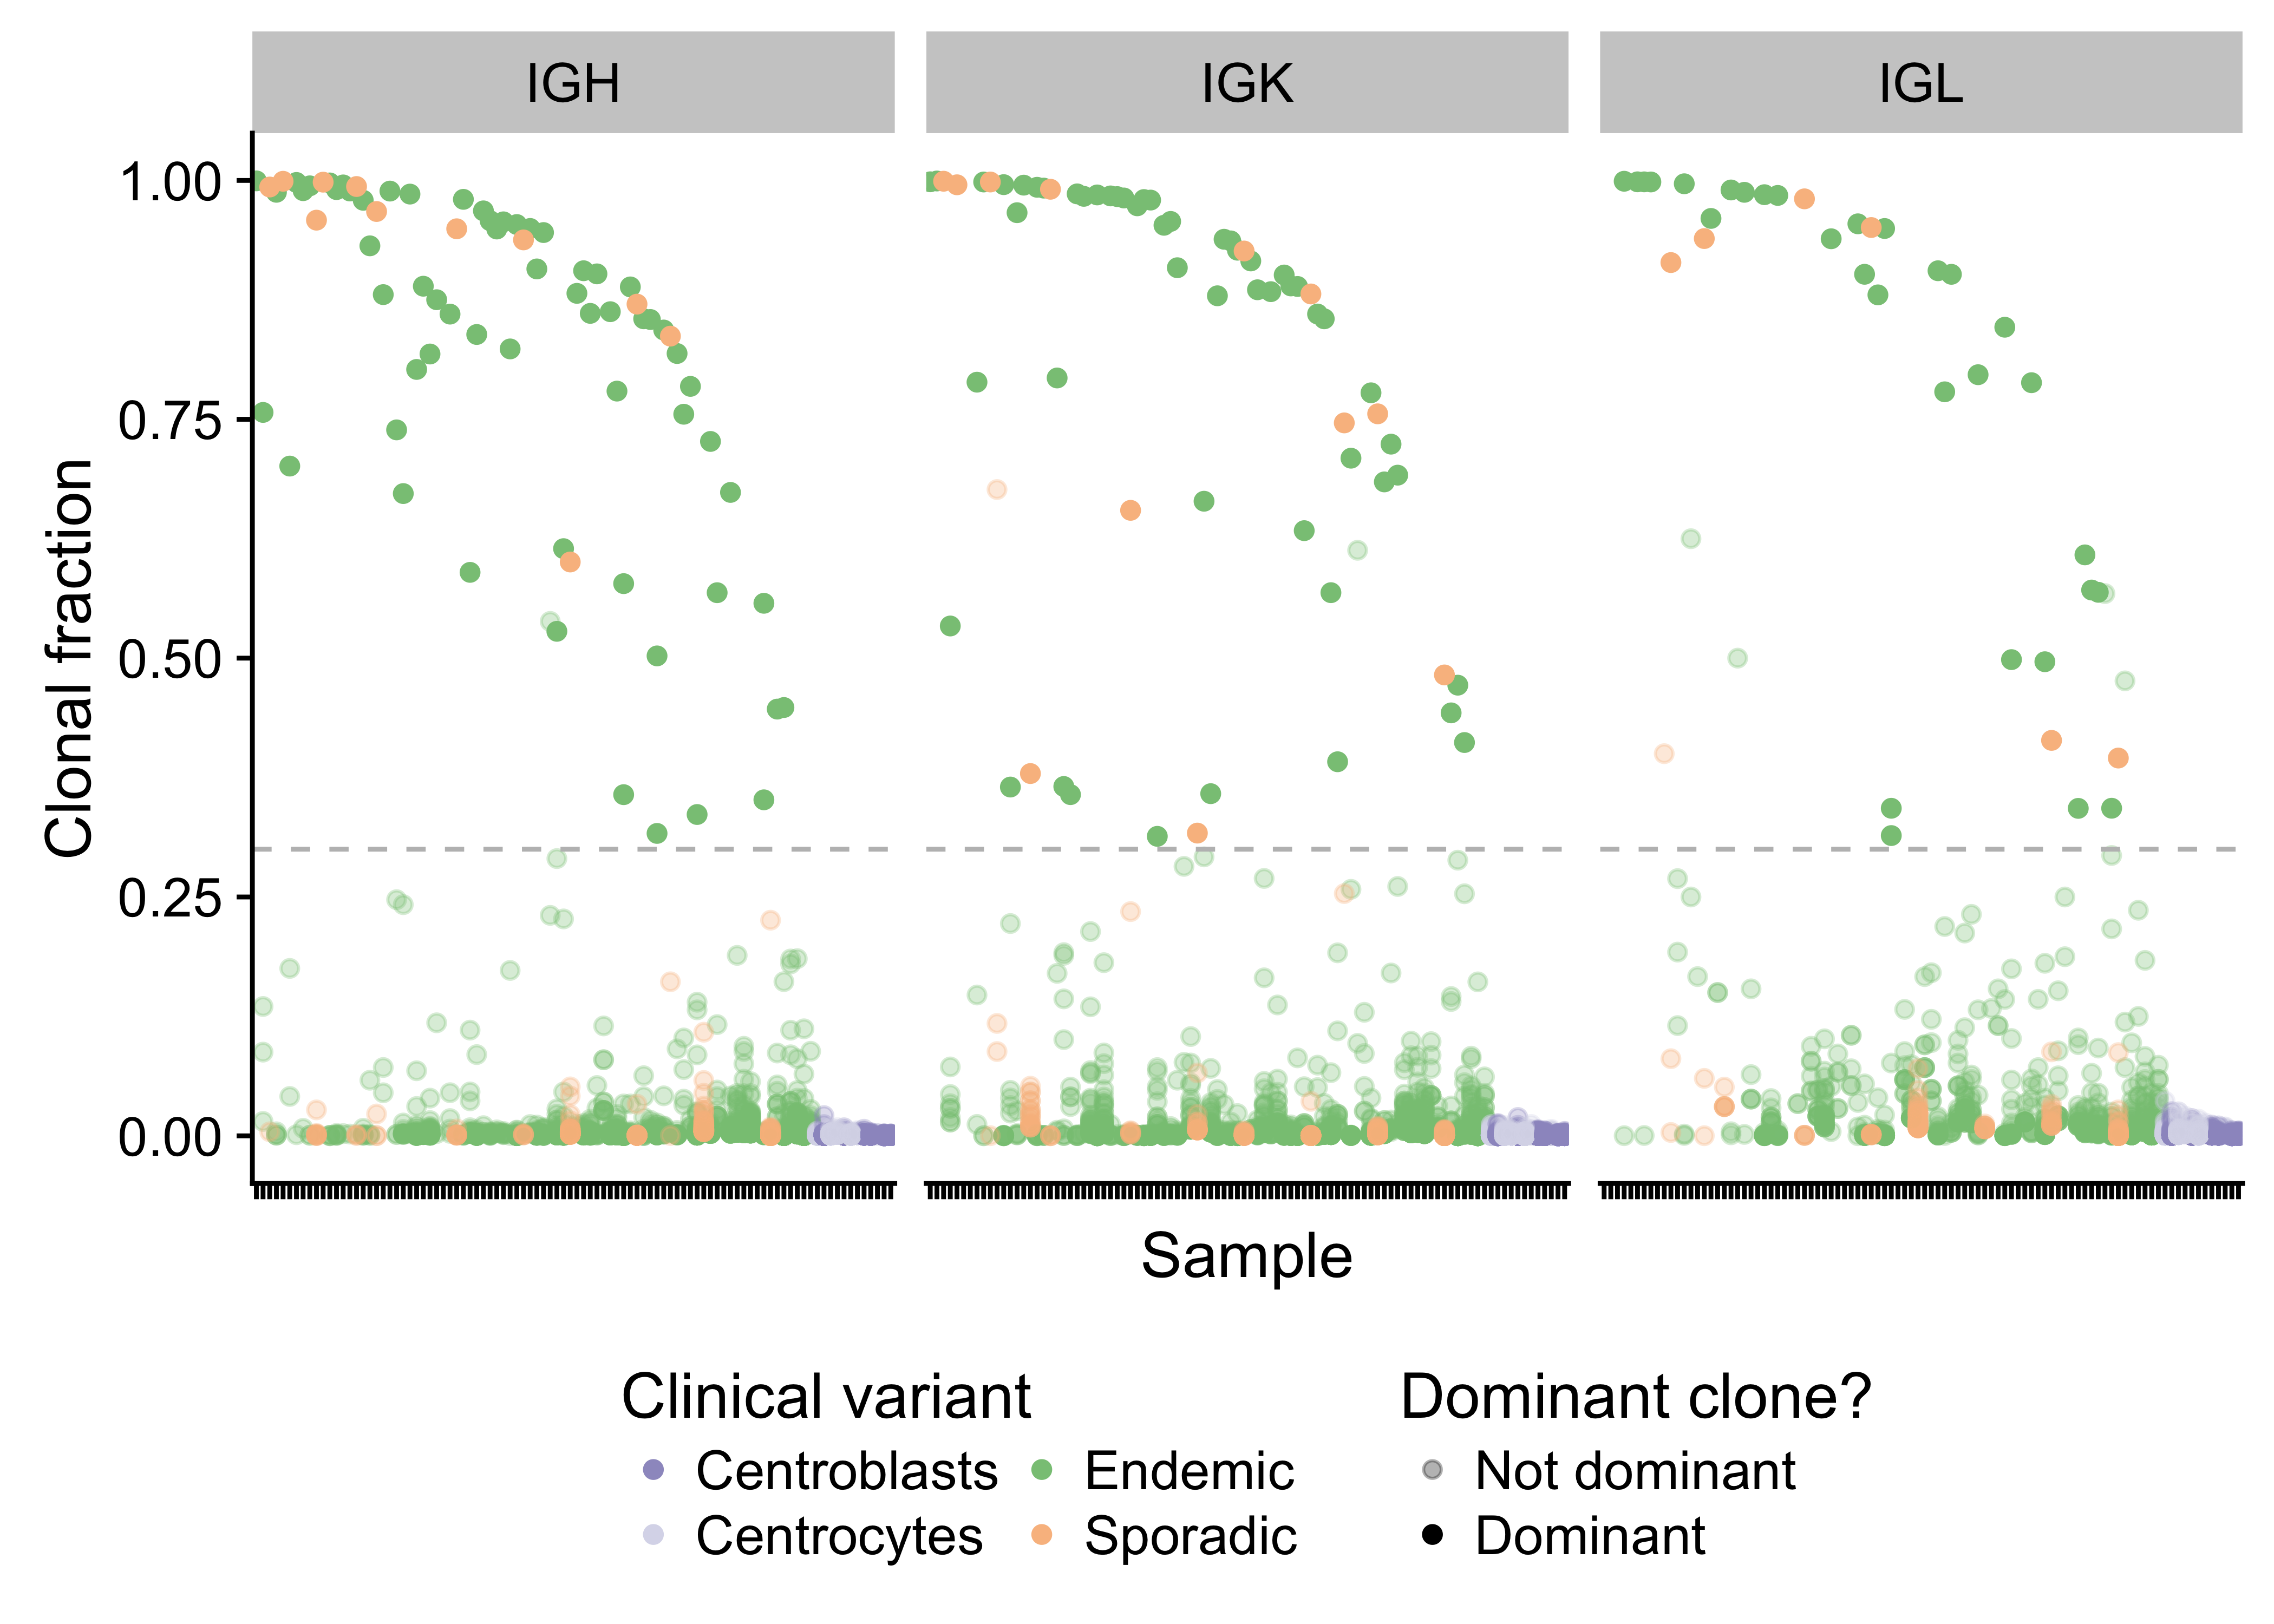
Figure 19: – Strip plot showing the clonal fraction of immunoglobulin heavy and light chains. The 30% minimum threshold in indicated by a dashed line. Translucent points above the dashed line failed to meet the required 30 supporting reads.
Page break
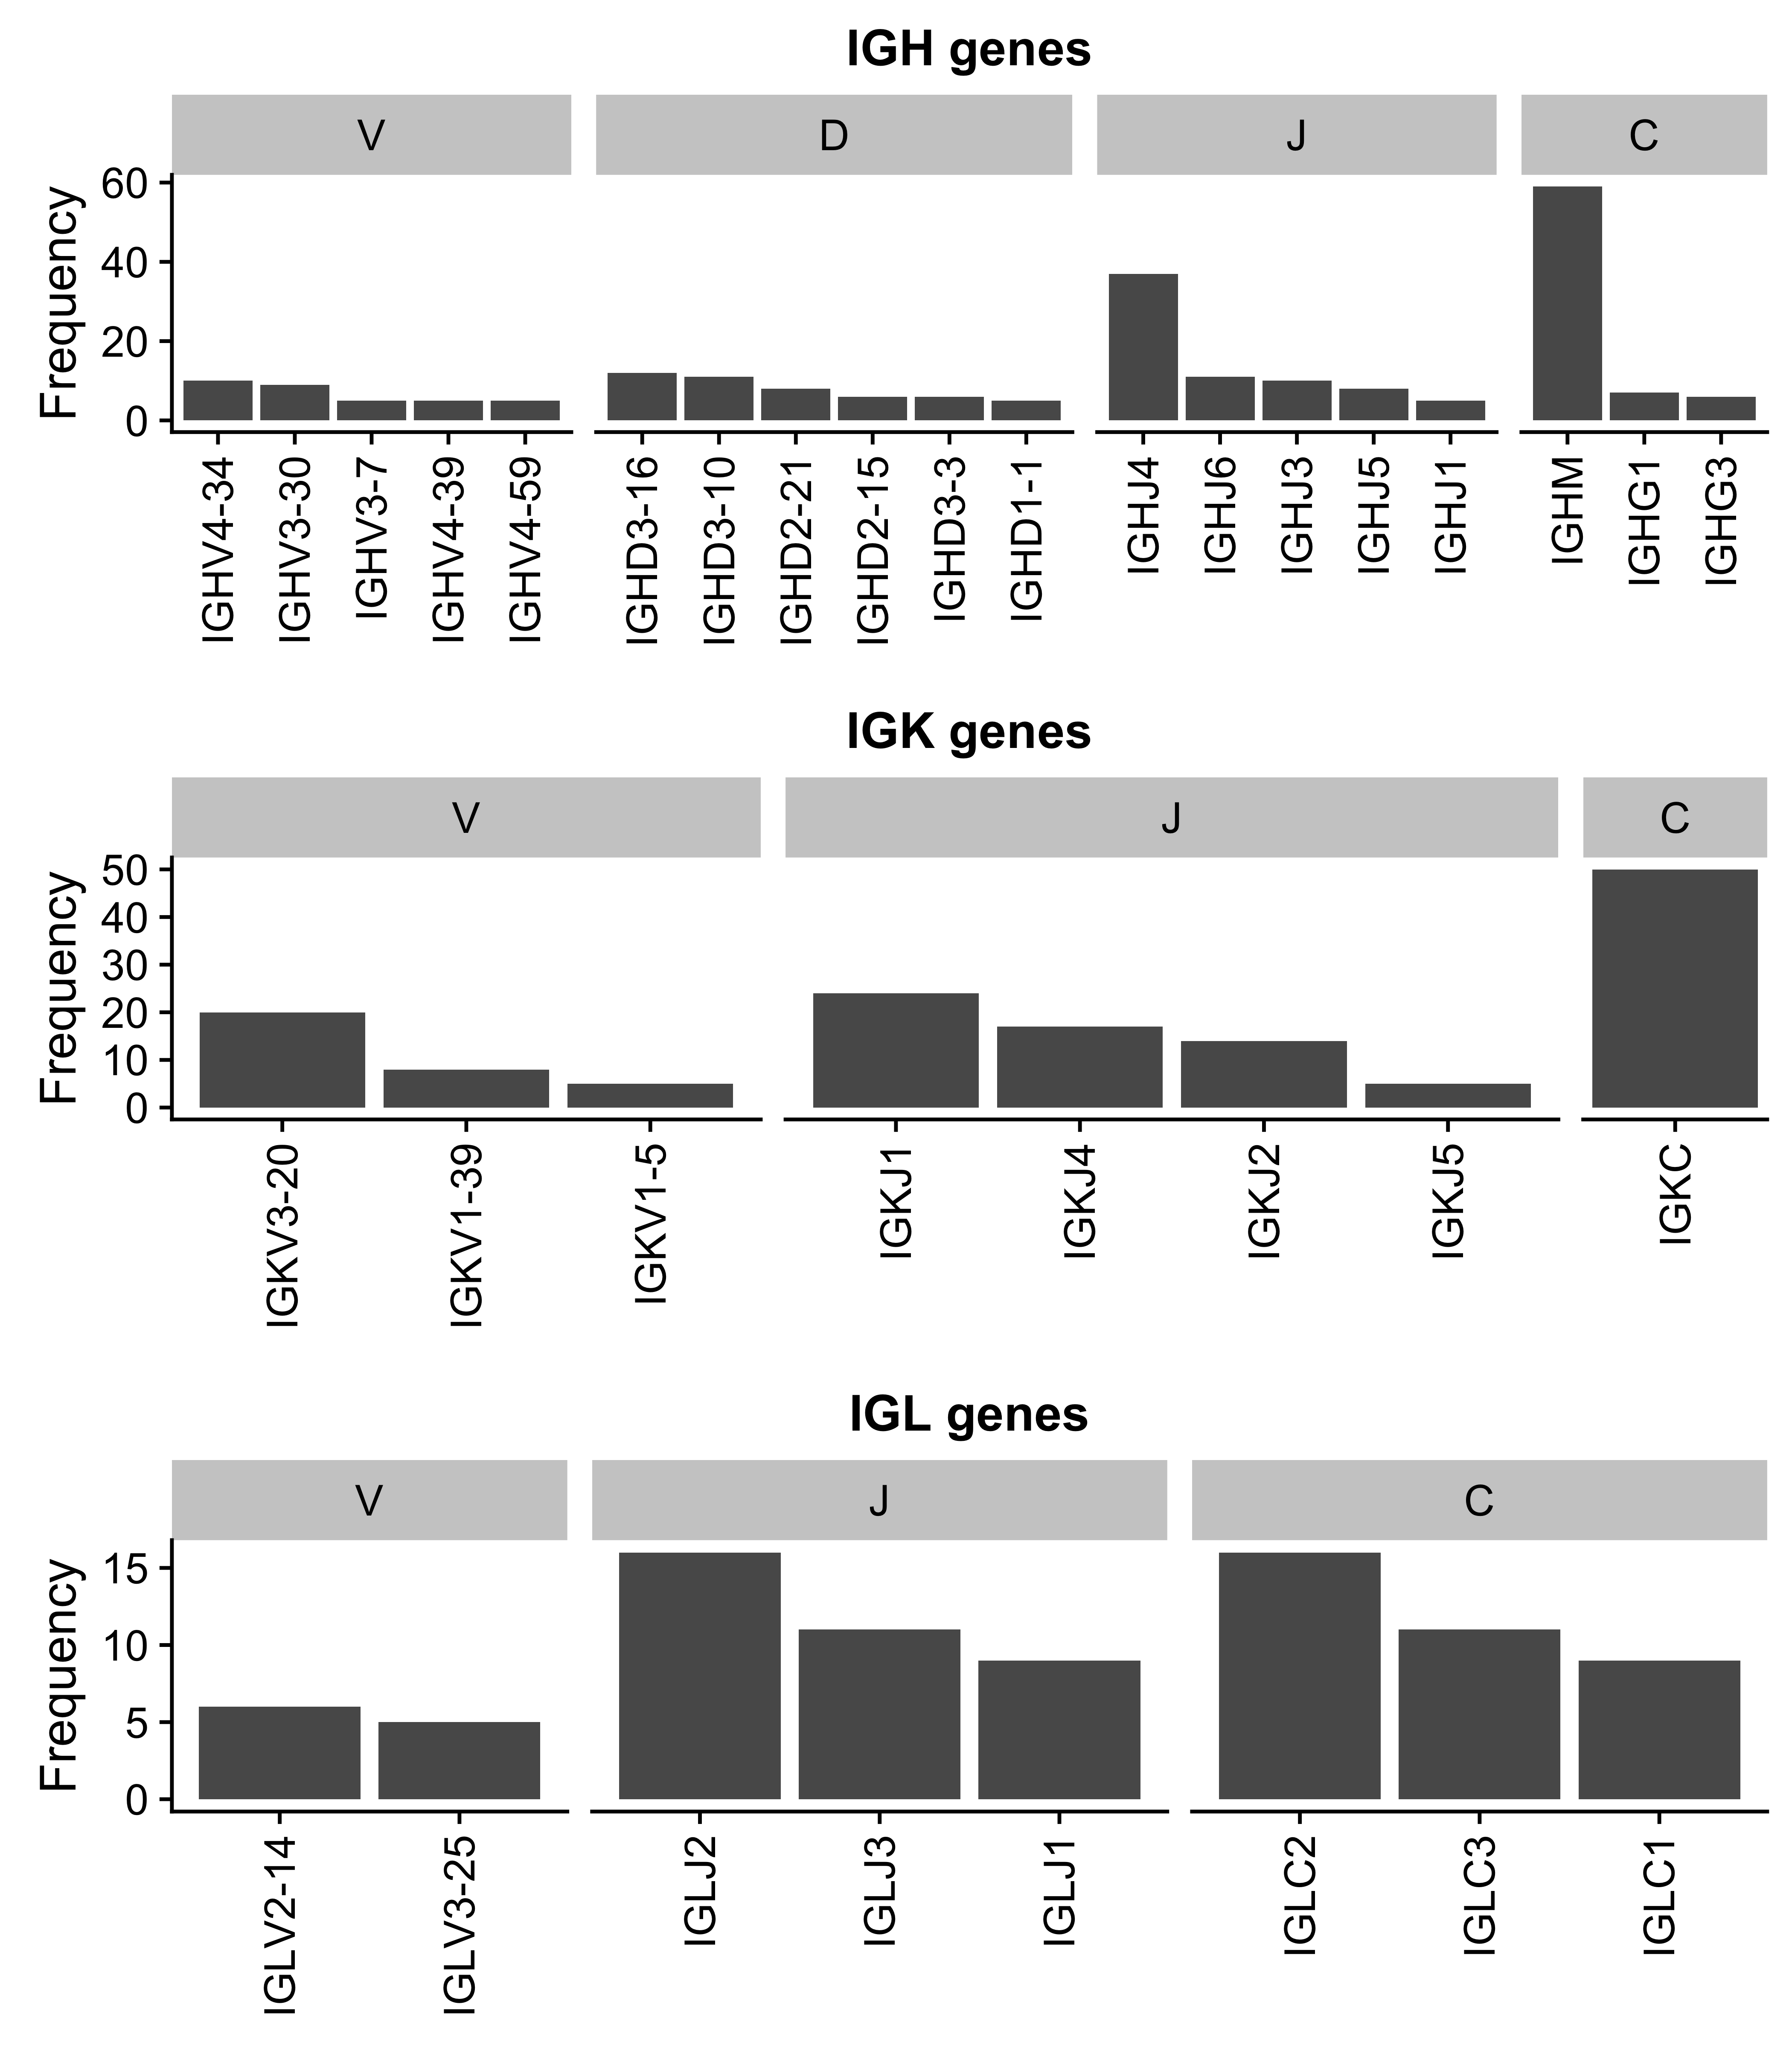
Figure 20: – Ig gene usage distribution for all V, D, J and C genes.
Page break
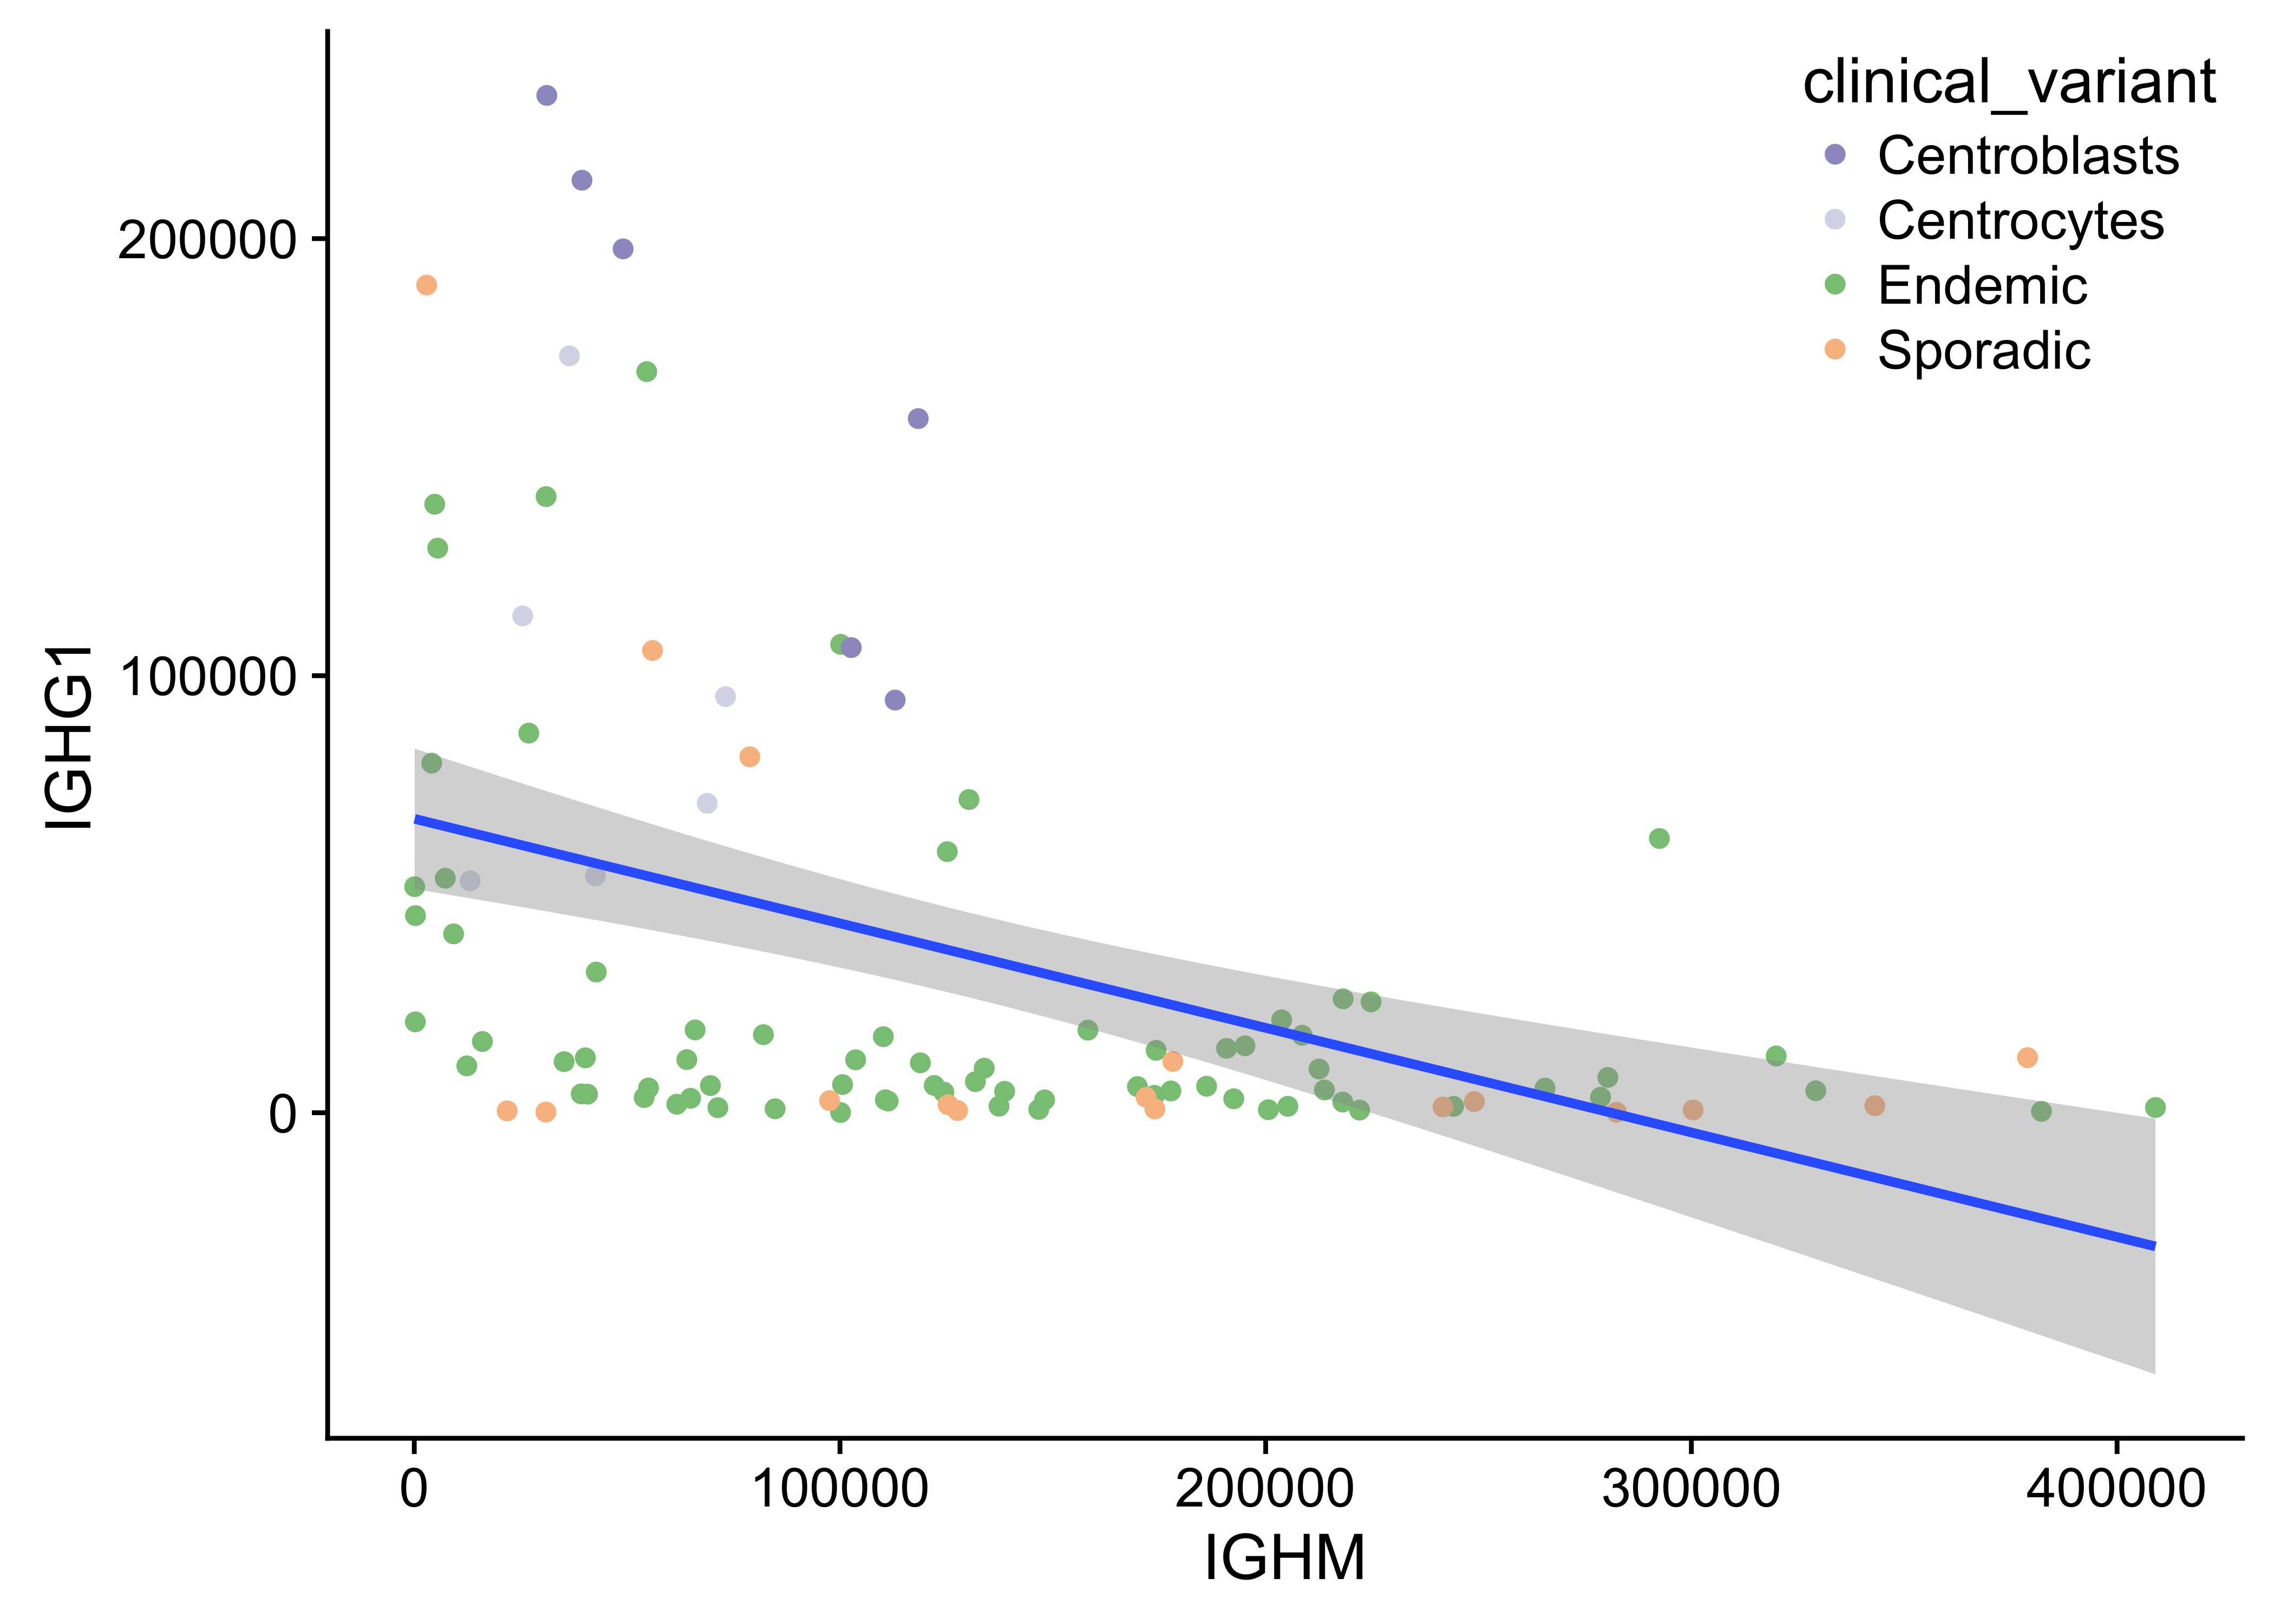
Figure 21: – Anti-correlated IGHM and IGHG1 expression.
Page break
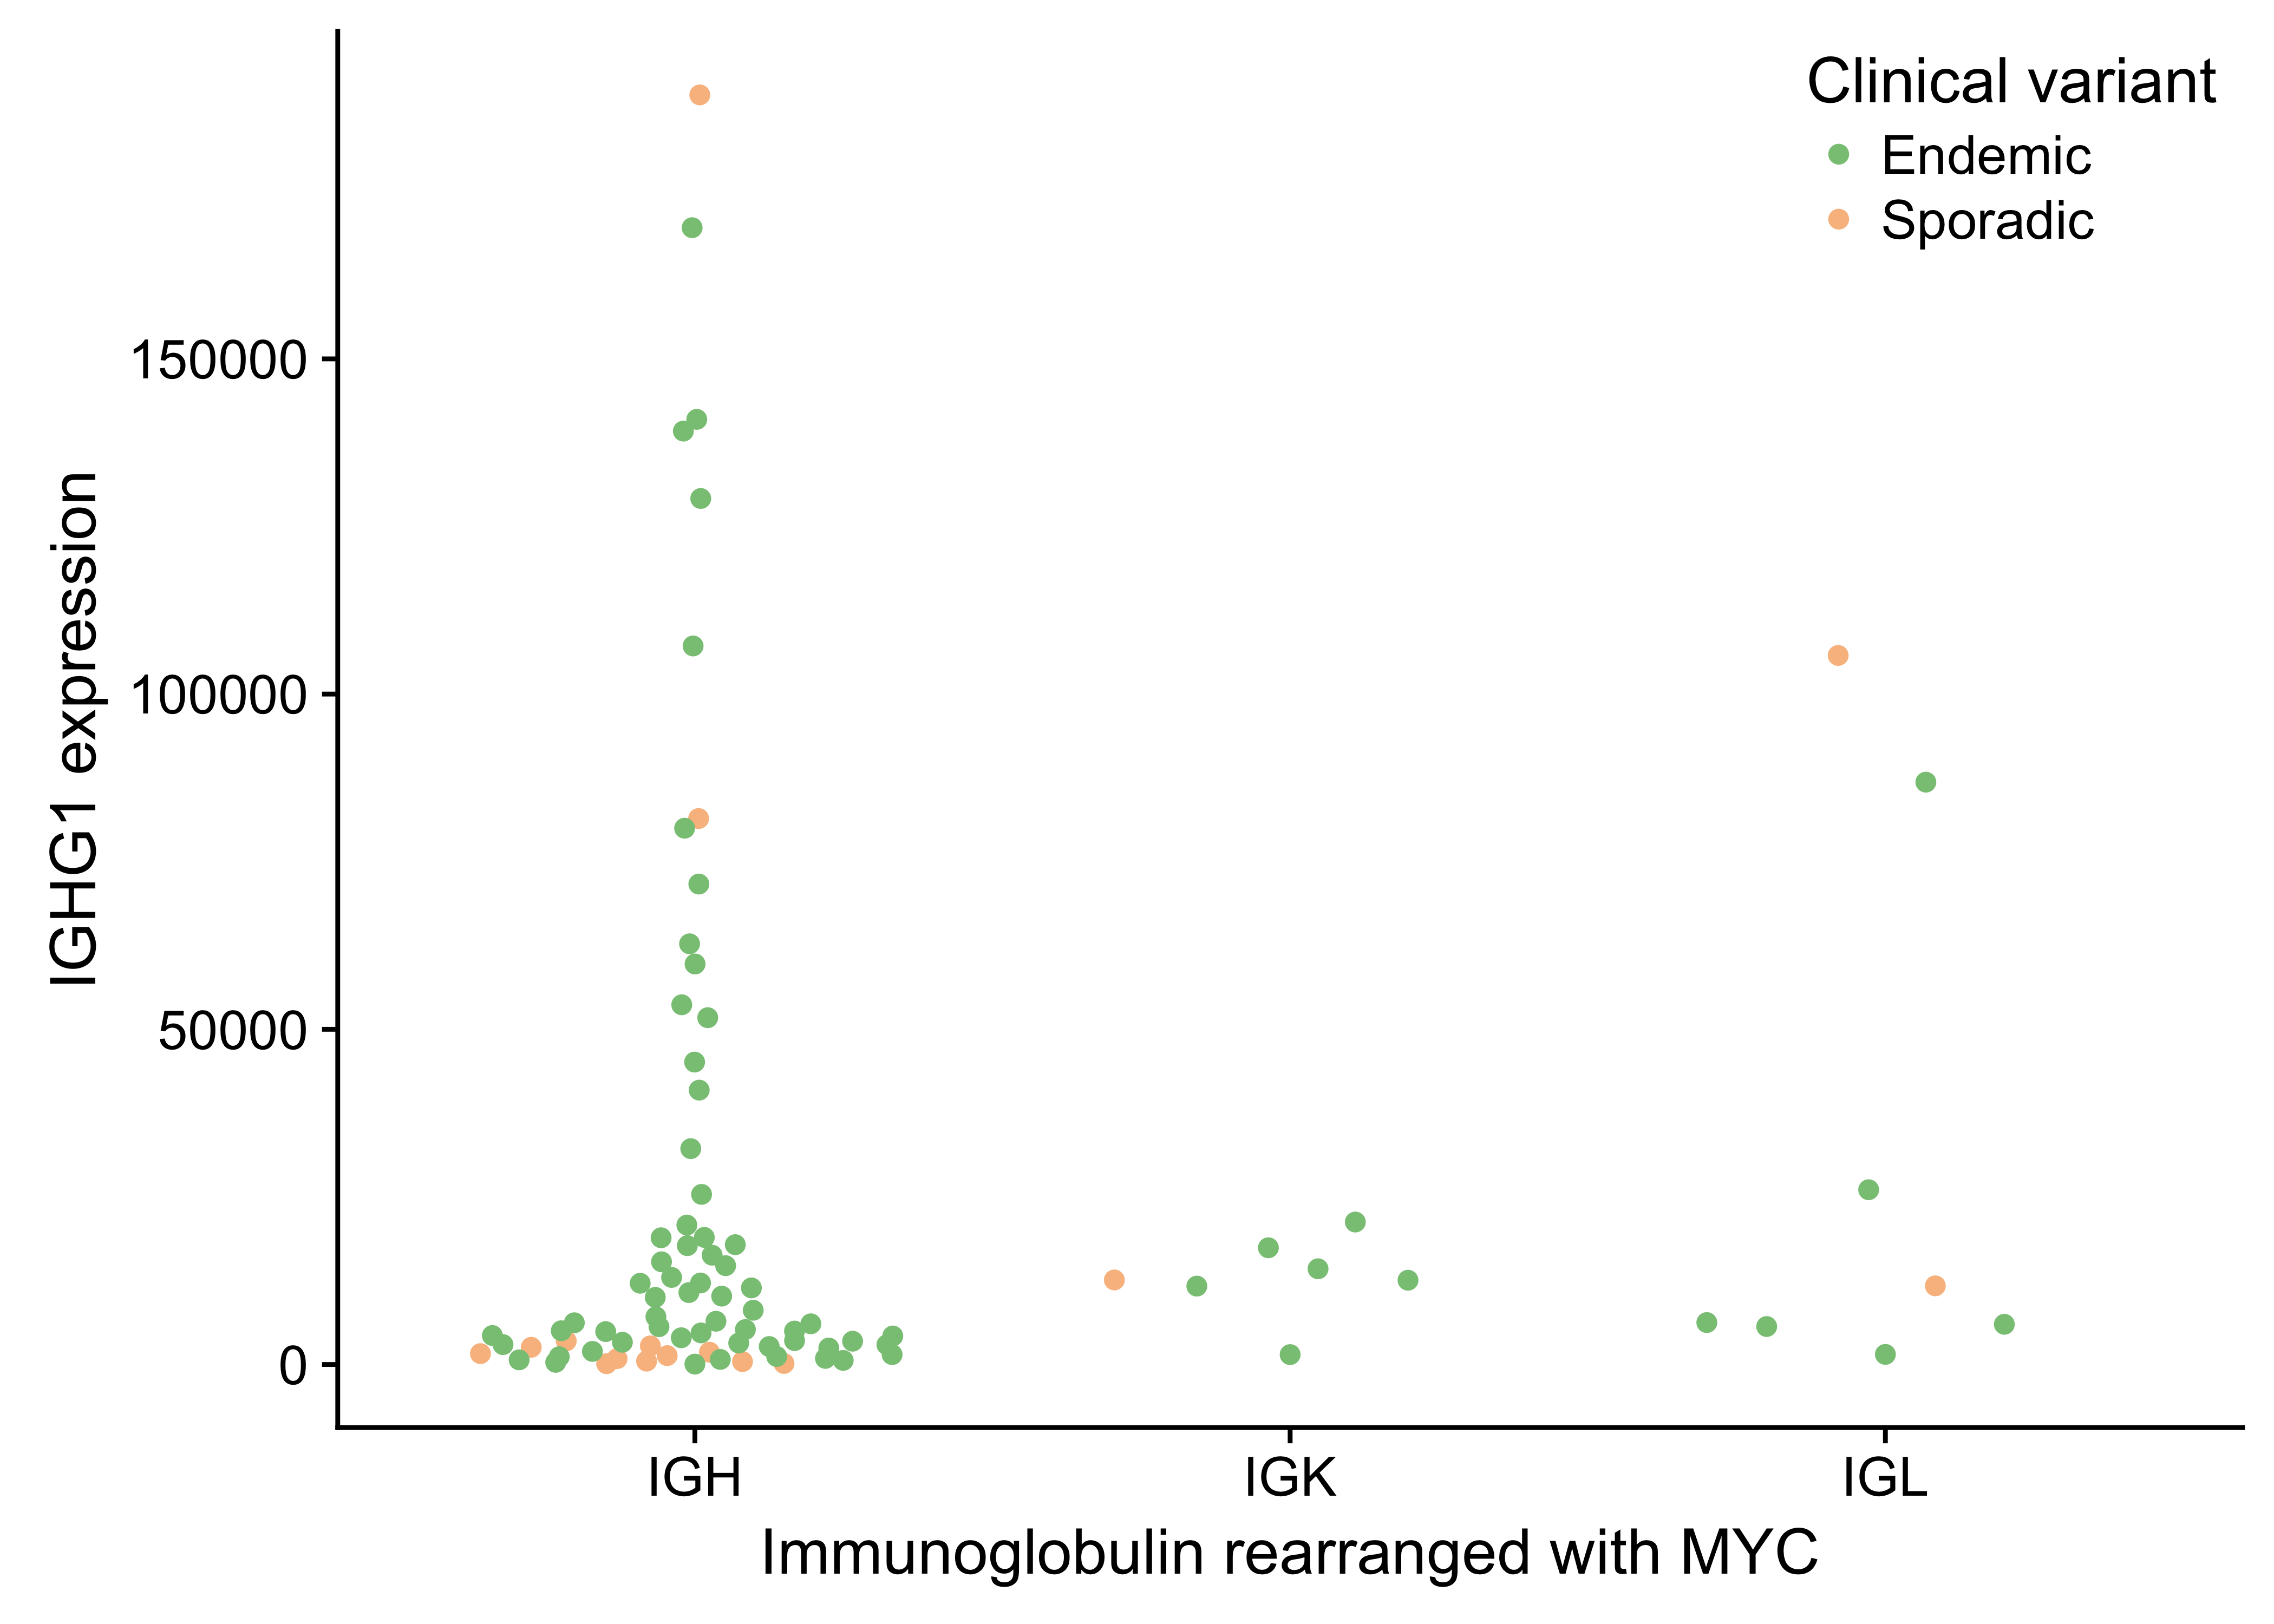
Figure 22: – No association between IGG expression and which immunnoglobulin is rearranged with MYC.
Page break
Supplementary Tables
| Heavy IG chain | Ligh IG chain | Frequency |
|---|---|---|
| IGHV4-34 | IGKV3-20 | 5 |
| IGHV4-39 | IGKV3-20 | 2 |
| IGHV3-30 | IGLV3-25 | 2 |
| IGHV4-59 | IGKV3-20 | 2 |
| IGHV4-34 | IGLV1-51 | 2 |
Page break
References
1. Magrath I. Epidemiology: Clues to the pathogenesis of burkitt lymphoma. Br. J. Haematol. 2012;156(6):744–756.
2. Buckle G, Maranda L, Skiles J, et al. Factors influencing survival among kenyan children diagnosed with endemic burkitt lymphoma between 2003 and 2011: A historical cohort study. Int. J. Cancer. 2016;139(6):1231–1240.
3. Dalla-Favera R, Bregni M, Erikson J, et al. Human c-myc onc gene is located on the region of chromosome 8 that is translocated in burkitt lymphoma cells. Proc. Natl. Acad. Sci. U. S. A. 1982;79(24):7824–7827.
4. Taub R, Kirsch I, Morton C, et al. Translocation of the c-myc gene into the immunoglobulin heavy chain locus in human burkitt lymphoma and murine plasmacytoma cells. Proc. Natl. Acad. Sci. U. S. A. 1982;79(24):7837–7841.
5. Burkitt D. A “tumour safari” in east and central africa. Br. J. Cancer. 1962;16:379–386.
6. Cohen JI. Epstein-Barr virus infection. N. Engl. J. Med. 2000;343(7):481–492.
7. Miller G. Immortalization of human lymphocytes by Epstein-Barr virus. Yale J. Biol. Med. 1982;55(3-4):305–310.
8. Grömminger S, Mautner J, Bornkamm GW. Burkitt lymphoma: The role of Epstein-Barr virus revisited. Br. J. Haematol. 2012;156(6):719–729.
9. Nanbo A, Sugden A, Sugden B. The coupling of synthesis and partitioning of EBV’s plasmid replicon is revealed in live cells. EMBO J. 2007;26(19):4252–4262.
10. Sant M, Allemani C, Tereanu C, et al. Incidence of hematologic malignancies in europe by morphologic subtype: Results of the HAEMACARE project. Blood. 2010;116(19):3724–3734.
11. Morton LM, Wang SS, Devesa SS, et al. Lymphoma incidence patterns by WHO subtype in the united states, 1992-2001. Blood. 2006;107(1):265–276.
12. Schmitz R, Ceribelli M, Pittaluga S, Wright GW, Staudt LM. Oncogenic mechanisms in burkitt lymphoma. Cold Spring Harb. Perspect. Med. 2014;4(2):a014282–a014282.
13. Costa LJ, Xavier AC, Wahlquist AE, Hill EG. Trends in survival of patients with burkitt lymphoma/leukemia in the USA: An analysis of 3691 cases. Blood. 2013;121(24):4861–4866.
14. Jacobson C, LaCasce A. How I treat burkitt lymphoma in adults. Blood. 2014;124(19):2913–2920.
15. Orem J, Maganda A, Mbidde EK, Weiderpass E. Clinical characteristics and outcome of children with burkitt lymphoma in uganda according to HIV infection. Pediatr. Blood Cancer. 2009;52(4):455–458.
16. Kojima Y, Hagiwara S, Uehira T, et al. Clinical outcomes of AIDS-related burkitt lymphoma: A multi-institution retrospective survey in japan. Jpn. J. Clin. Oncol. 2014;44(4):318–323.
17. Puga L B, Bustamante K K, Molina E J, Andrade M A. [Intensive chemotherapy for burkitt lymphoma in HIV positive patients]. Rev. Med. Chil. 2015;143(12):1505–1511.
18. Schmitz R, Young RM, Ceribelli M, et al. Burkitt lymphoma pathogenesis and therapeutic targets from structural and functional genomics. Nature. 2012;490(7418):116–120.
19. Richter J, Schlesner M, Hoffmann S, et al. Recurrent mutation of the ID3 gene in burkitt lymphoma identified by integrated genome, exome and transcriptome sequencing. Nat. Genet. 2012;44(12):1316–1320.
20. Love C, Sun Z, Jima D, et al. The genetic landscape of mutations in burkitt lymphoma. Nat. Genet. 2012;44(12):1321–1325.
21. Abate F, Ambrosio MR, Mundo L, et al. Distinct viral and mutational spectrum of endemic burkitt lymphoma. PLoS Pathog. 2015;11(10):e1005158.
22. Kaymaz Y, Oduor CI, Yu H, et al. Comprehensive transcriptome and mutational profiling of endemic burkitt lymphoma reveals EBV type-specific differences. Mol. Cancer Res. 2017;
23. Hezaveh K, Kloetgen A, Bernhart SH, et al. Alterations of microRNA and microRNA-regulated messenger RNA expression in germinal center b-cell lymphomas determined by integrative sequencing analysis. Haematologica. 2016;101(11):1380–1389.
24. Arthur S, Jiang A, Grande B, et al. Genome-wide discovery of somatic coding and regulatory variants in diffuse large b-cell lymphoma. bioRxiv. 2017;225870.
25. Jiang Y, Soong TD, Wang L, Melnick AM, Elemento O. Genome-wide detection of genes targeted by non-ig somatic hypermutation in lymphoma. PLoS One. 2012;7(7):e40332.
26. Raffeld M, Yano T, Hoang AT, et al. Clustered mutations in the transcriptional activation domain of myc in 8q24 translocated lymphomas and their functional consequences. Curr. Top. Microbiol. Immunol. 1995;194:265–272.
27. Rabbitts TH, Hamlyn PH, Baer R. Altered nucleotide sequences of a translocated c-myc gene in burkitt lymphoma. Nature. 1983;306(5945):760–765.
28. Pasqualucci L, Neumeister P, Goossens T, et al. Hypermutation of multiple proto-oncogenes in b-cell diffuse large-cell lymphomas. Nature. 2001;412(6844):341–346.
29. Puente XS, Beà S, Valdés-Mas R, et al. Non-coding recurrent mutations in chronic lymphocytic leukaemia. Nature. 2015;526(7574):519–524.
30. Kwanhian W, Lenze D, Alles J, et al. MicroRNA-142 is mutated in about 20% of diffuse large b-cell lymphoma. Cancer Med. 2012;1(2):141–155.
31. Carramusa L, Contino F, Ferro A, et al. The PVT-1 oncogene is a myc protein target that is overexpressed in transformed cells. J. Cell. Physiol. 2007;213(2):511–518.
32. Barsotti AM, Beckerman R, Laptenko O, et al. P53-dependent induction of PVT1 and miR-1204. J. Biol. Chem. 2012;287(4):2509–2519.
33. Wei C-L, Wu Q, Vega VB, et al. A global map of p53 transcription-factor binding sites in the human genome. Cell. 2006;124(1):207–219.
34. Golub TR, Slonim DK, Tamayo P, et al. Molecular classification of cancer: Class discovery and class prediction by gene expression monitoring. Science. 1999;286(5439):531–537.
35. Victora GD, Dominguez-Sola D, Holmes AB, et al. Identification of human germinal center light and dark zone cells and their relationship to human b-cell lymphomas. Blood. 2012;120(11):2240–2248.
36. Dave SS, Fu K, Wright GW, et al. Molecular diagnosis of burkitt’s lymphoma. N. Engl. J. Med. 2006;354(23):2431–2442.
37. Caron G, Le Gallou S, Lamy T, Tarte K, Fest T. CXCR4 expression functionally discriminates centroblasts versus centrocytes within human germinal center B cells. J. Immunol. 2009;182(12):7595–7602.
38. Kalchschmidt JS, Bashford-Rogers R, Paschos K, et al. Epstein-Barr virus nuclear protein EBNA3C directly induces expression of AID and somatic mutations in B cells. J. Exp. Med. 2016;213(6):921–928.
39. Sandlund JT, Kastan MB, Kennedy W, et al. A subtle t(3;8) results in plausible juxtaposition of MYC and BCL6 in a child with burkitt lymphoma/leukemia and ataxia-telangiectasia. Cancer Genet. Cytogenet. 2006;168(1):69–72.
40. Wang H-Y, Bossler AD, Schaffer A, et al. A novel t(3;8)(q27;q24.1) simultaneously involving both the BCL6 and MYC genes in a diffuse large b-cell lymphoma. Cancer Genet. Cytogenet. 2007;172(1):45–53.
41. Bertrand P, Bastard C, Maingonnat C, et al. Mapping of MYC breakpoints in 8q24 rearrangements involving non-immunoglobulin partners in b-cell lymphomas. Leukemia. 2007;21(3):515–523.
42. Huret JL. T(3;8)(q27;q24). 2009;
43. Stone J, Lange T de, Ramsay G, et al. Definition of regions in human c-myc that are involved in transformation and nuclear localization. Mol. Cell. Biol. 1987;7(5):1697–1709.
44. Salaverria I, Martin-Guerrero I, Wagener R, et al. A recurrent 11q aberration pattern characterizes a subset of MYC-negative high-grade b-cell lymphomas resembling burkitt lymphoma. Blood. 2014;123(8):1187–1198.
45. Swerdlow S, Campo E, Harris NL, et al. WHO classification of tumours of haematopoietic and lymphoid tissues (IARC WHO classification of tumours). World Health Organization; 2017.
46. Grygalewicz B, Woroniecka R, Rymkiewicz G, et al. The 11q-Gain/Loss aberration occurs recurrently in MYC-Negative burkitt-like lymphoma with 11q aberration, as well as MYC-Positive burkitt lymphoma and MYC-Positive High-Grade B-Cell lymphoma, NOS. Am. J. Clin. Pathol. 2017;149(1):17–28.
47. Rymkiewicz G, Grygalewicz B, Chechlinska M, et al. A comprehensive flow-cytometry-based immunophenotypic characterization of burkitt-like lymphoma with 11q aberration. Mod. Pathol. 2018;
48. Bolotin DA, Poslavsky S, Davydov AN, et al. Antigen receptor repertoire profiling from RNA-seq data. Nat. Biotechnol. 2017;35(10):908–911.
49. Bolotin DA, Poslavsky S, Mitrophanov I, et al. MiXCR: Software for comprehensive adaptive immunity profiling. Nat. Methods. 2015;12(5):380–381.
50. Lombardo KA, Coffey DG, Morales AJ, et al. High-throughput sequencing of the b-cell receptor in african burkitt lymphoma reveals clues to pathogenesis. Blood Adv. 2017;1(9):535–544.
51. Amato T, Abate F, Piccaluga P, et al. Clonality analysis of immunoglobulin gene rearrangement by Next-Generation sequencing in endemic burkitt lymphoma suggests antigen drive activation of BCR as opposed to sporadic burkitt lymphoma. Am. J. Clin. Pathol. 2016;145(1):116–127.
52. Baptista MJ, Calpe E, Fernandez E, et al. Analysis of the IGHV region in burkitt’s lymphomas supports a germinal center origin and a role for superantigens in lymphomagenesis. Leuk. Res. 2014;38(4):509–515.
53. Kostareli E, Gounari M, Janus A, et al. Antigen receptor stereotypy across b-cell lymphoproliferations: The case of IGHV4-59/IGKV3-20 receptors with rheumatoid factor activity. Leukemia. 2012;26(5):1127–1131.
54. Lawrence MS, Stojanov P, Polak P, et al. Mutational heterogeneity in cancer and the search for new cancer-associated genes. Nature. 2013;499(7457):214–218.
55. Tamborero D, Gonzalez-Perez A, Lopez-Bigas N. OncodriveCLUST: Exploiting the positional clustering of somatic mutations to identify cancer genes. Bioinformatics. 2013;29(18):2238–2244.
56. Mularoni L, Sabarinathan R, Deu-Pons J, Gonzalez-Perez A, López-Bigas N. OncodriveFML: A general framework to identify coding and non-coding regions with cancer driver mutations. Genome Biol. 2016;17(1):128.
57. Gonzalez-Perez A, Lopez-Bigas N. Functional impact bias reveals cancer drivers. Nucleic Acids Res. 2012;40(21):e169.
58. Nascimento EM, Cox CL, MacArthur S, et al. The opposing transcriptional functions of sin3a and c-myc are required to maintain tissue homeostasis. Nat. Cell Biol. 2011;13(12):1395–1405.
59. Li M, Chen D, Shiloh A, et al. Deubiquitination of p53 by HAUSP is an important pathway for p53 stabilization. Nature. 2002;416(6881):648–653.
60. Holowaty MN, Frappier L. HAUSP/USP7 as an Epstein-Barr virus target. Biochem. Soc. Trans. 2004;32(Pt 5):731–732.
61. Renouf B, Hollville E, Pujals A, et al. Activation of p53 by MDM2 antagonists has differential apoptotic effects on Epstein-Barr virus (EBV)-positive and EBV-negative burkitt’s lymphoma cells. Leukemia. 2009;23(9):1557–1563.