| group A | group B |
|---|---|
| SN2 | S&N2 WT DLBCL |
| female SN2 | female S&N2 WT DLBCL |
| non-GCB SN2 | non-GCB S&N2 WT DLBCL |
| female SN2 non-GCB | female non-GCB S&N2 WT DLBCL |
| BN2 | other LymphGen clusters |
| female BN2 | other female LymphGen clusters |
Signatures of SPEN/NOTCH2 double mutants in DLBCL
Background
SPEN and NOTCH2 are frequently co-mutated in DLBCL, and both are common features of the BN2 LymphGen genetic subtype. Benedikt Pelzer in the Melnick Lab has performed extensive characterization of double mutants using mouse models and identified gene expression signatures associated with the double mutant. Here, we will explore the gene expression landscape of double mutants in RNAseq from human DLBCL patients.
Differential expression analysis
Ben sent an analysis plan with pairs of conditions in which to test for enrichment of signature gene sets. The first step will be to identify GAMBL data that meet these criteria. Qualifying cases will be DLBCLs with both genome/exome and RNAseq data, and can include external data sets, such as Schmitz.
The analysis plan requres the identification of tumours based on mutation status, sex, COO, and LymphGen subtype. The first step is to identify the relevant cohorts and then filter the data to include only those cases.
| cohort | n |
|---|---|
| DLBCL_DLC | 1 |
| DLBCL_Gascoyne | 21 |
| DLBCL_GenomeCanada | 56 |
| DLBCL_Hilton | 18 |
| DLBCL_LSARP_Trios | 97 |
| DLBCL_Marra | 36 |
| dlbcl_schmitz | 463 |
This results in 692 samples with both RNAseq and DNAseq data.
The next step is to assign each case the values for each group in the analysis plan. The original Schmitz maf includes variant calls from RNAseq and HaloPlex, and at least one case has mutations that are not in the exome data, so the original Schmitz maf will be used to obtain variant calls for these cases.
In total, out of 692 samples, 11 have mutations in both SPEN and NOTCH2.
[1] "sn2_vs_wt"
0 1
627 11
[1] "sn2_vs_wt_female"
0 1
241 9
[1] "sn2_vs_wt_nonGCB"
0 1
365 9
[1] "sn2_vs_wt_nonGCB_female"
0 1
143 7
[1] "sn2_vs_wt_BN2"
0 1
73 11
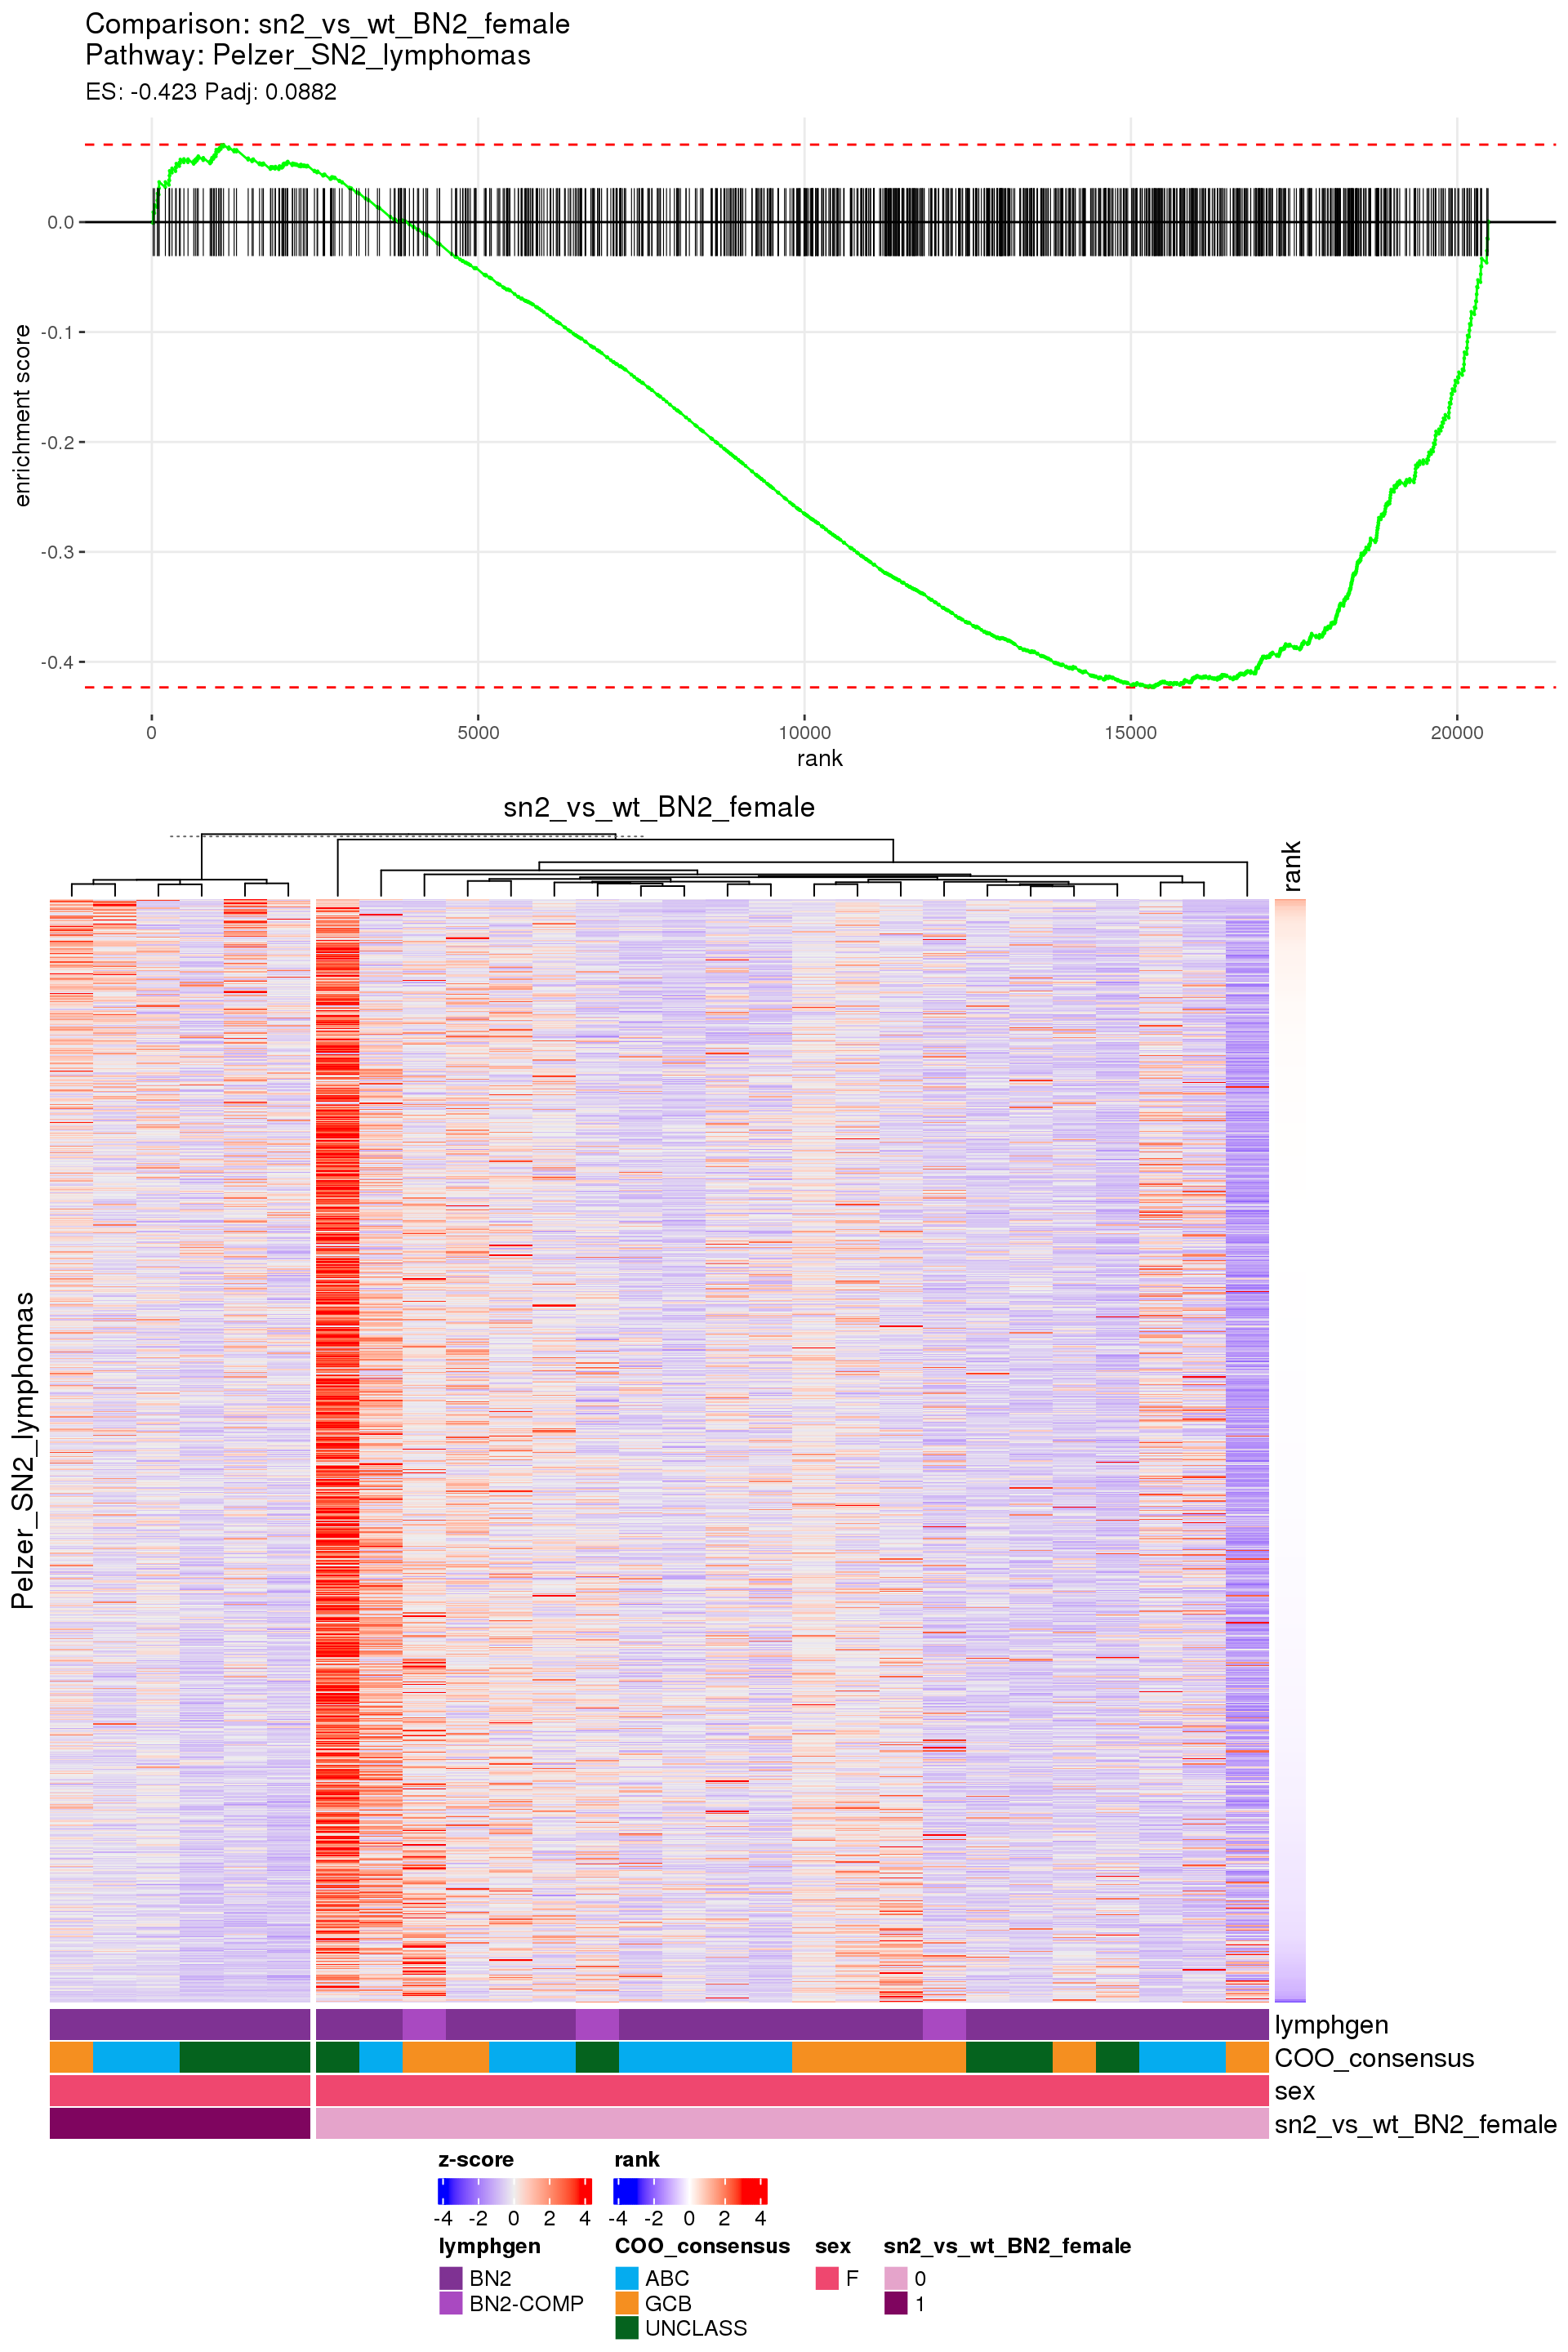
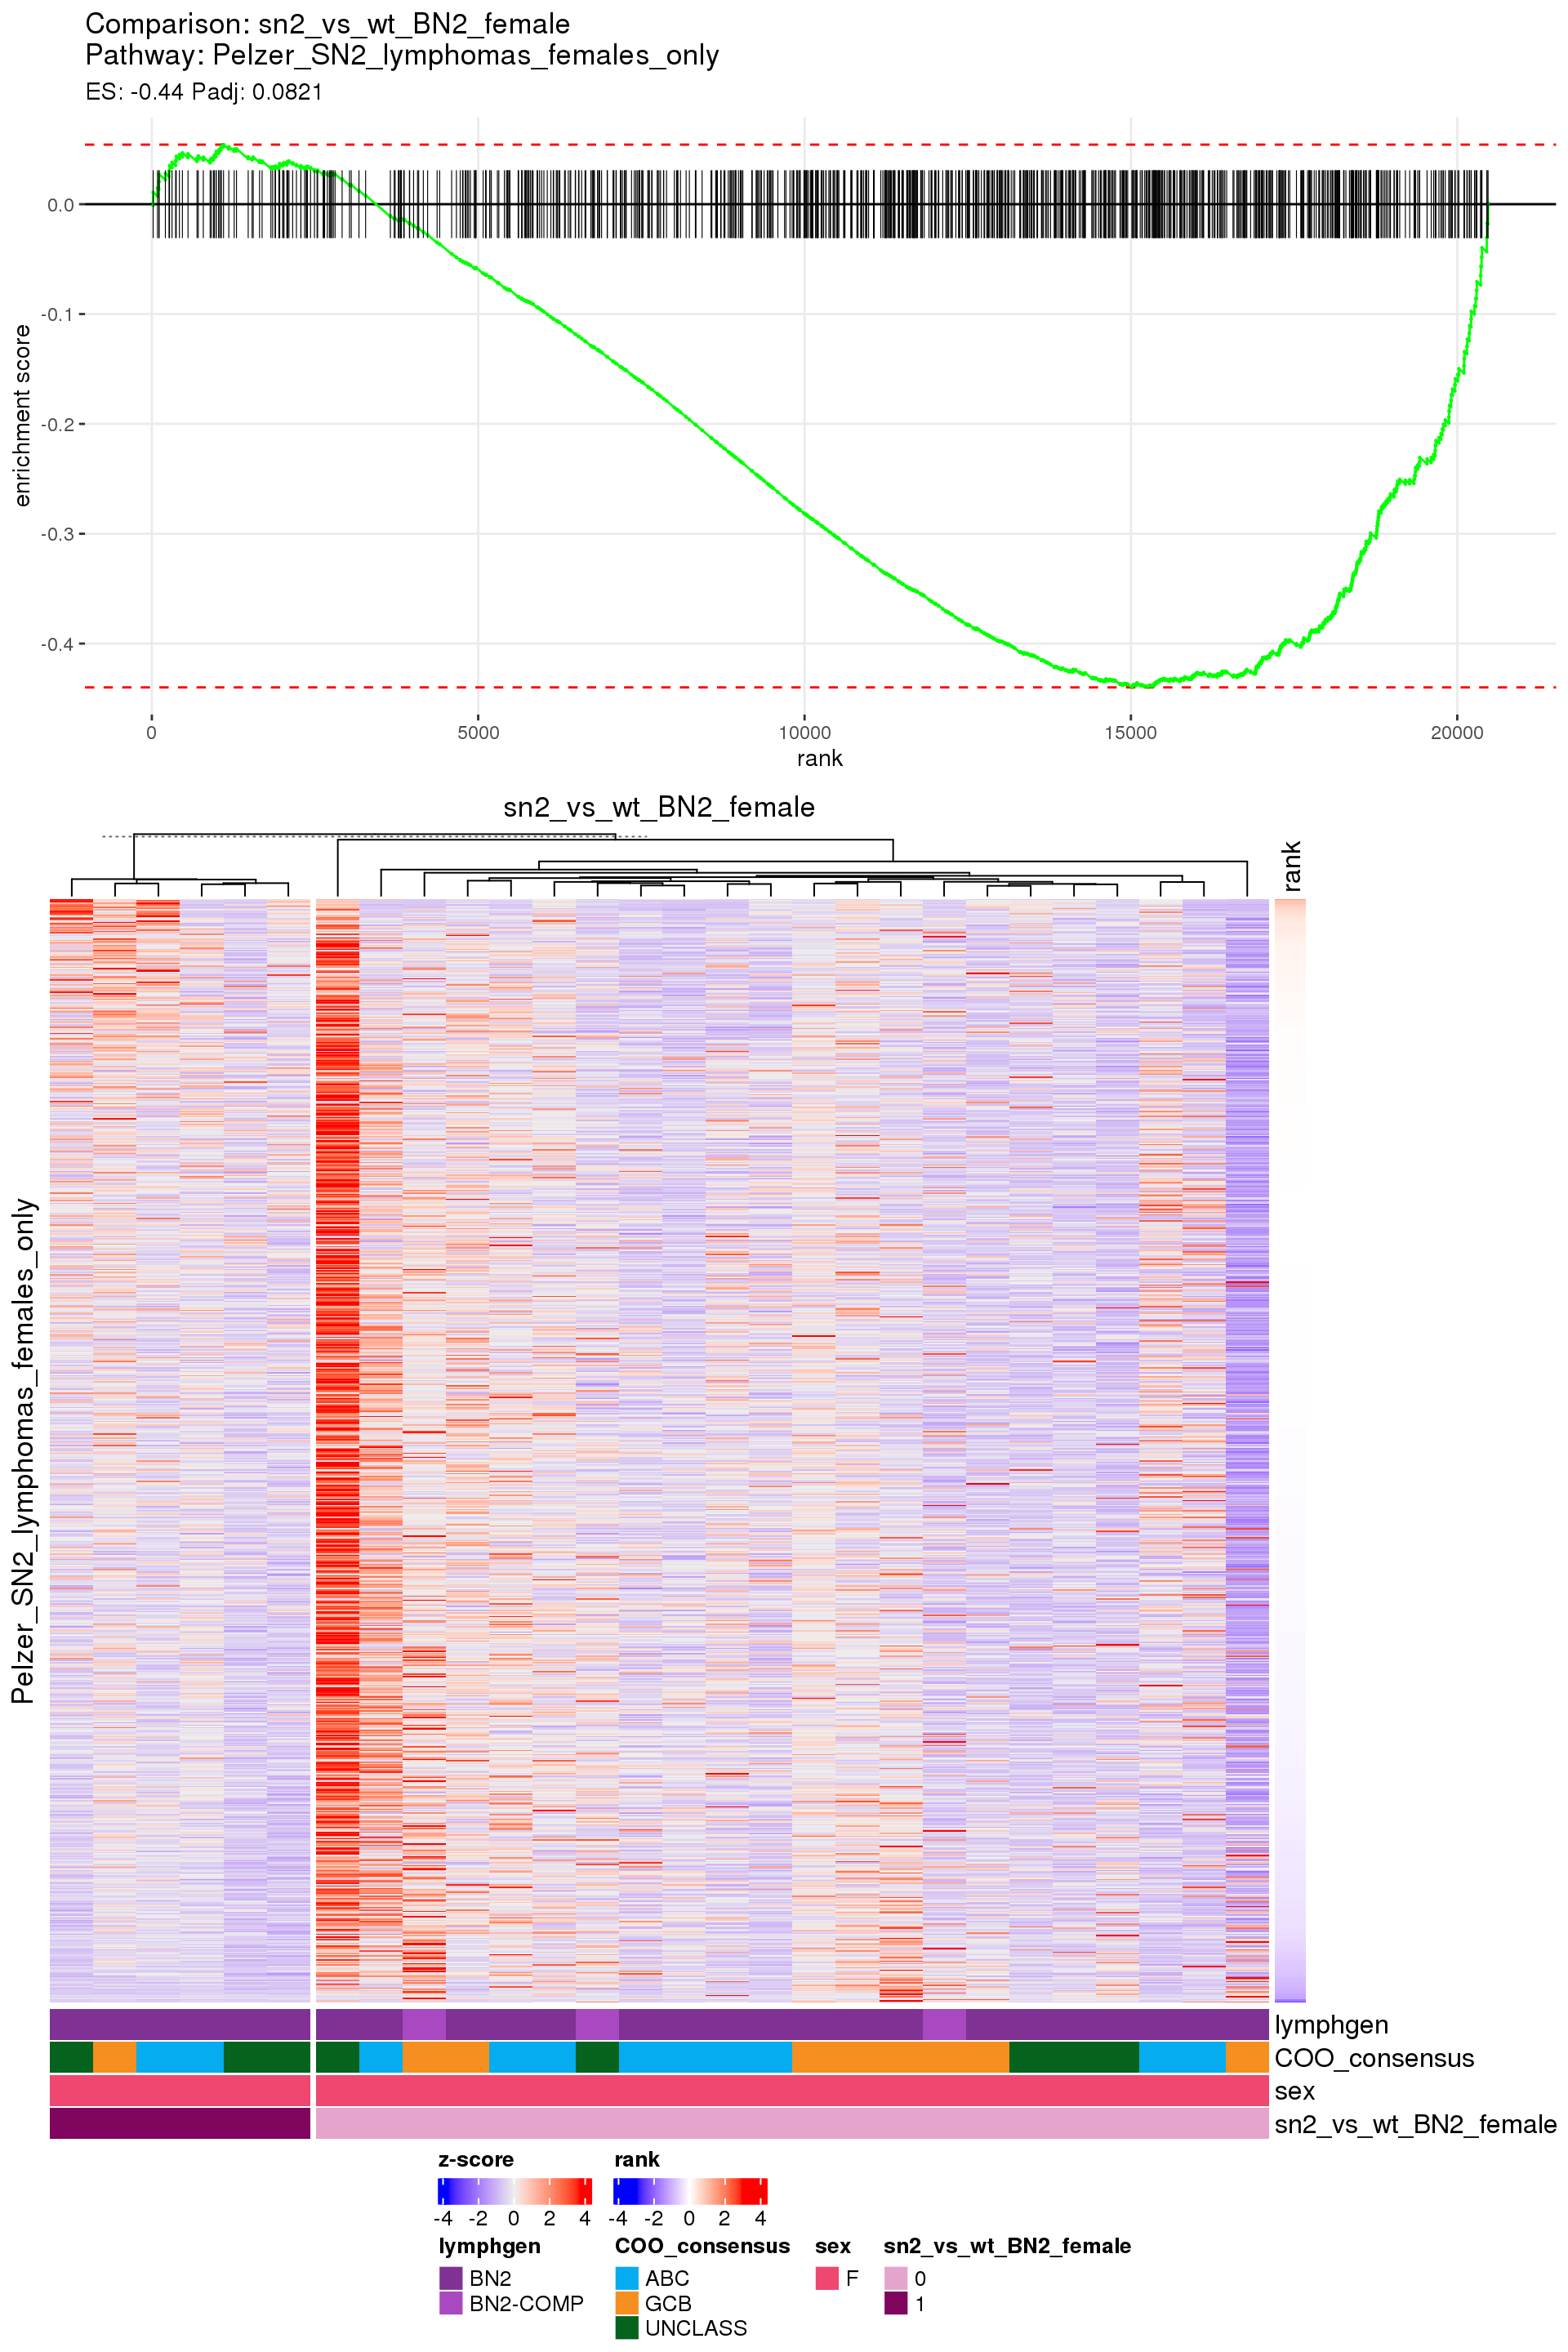
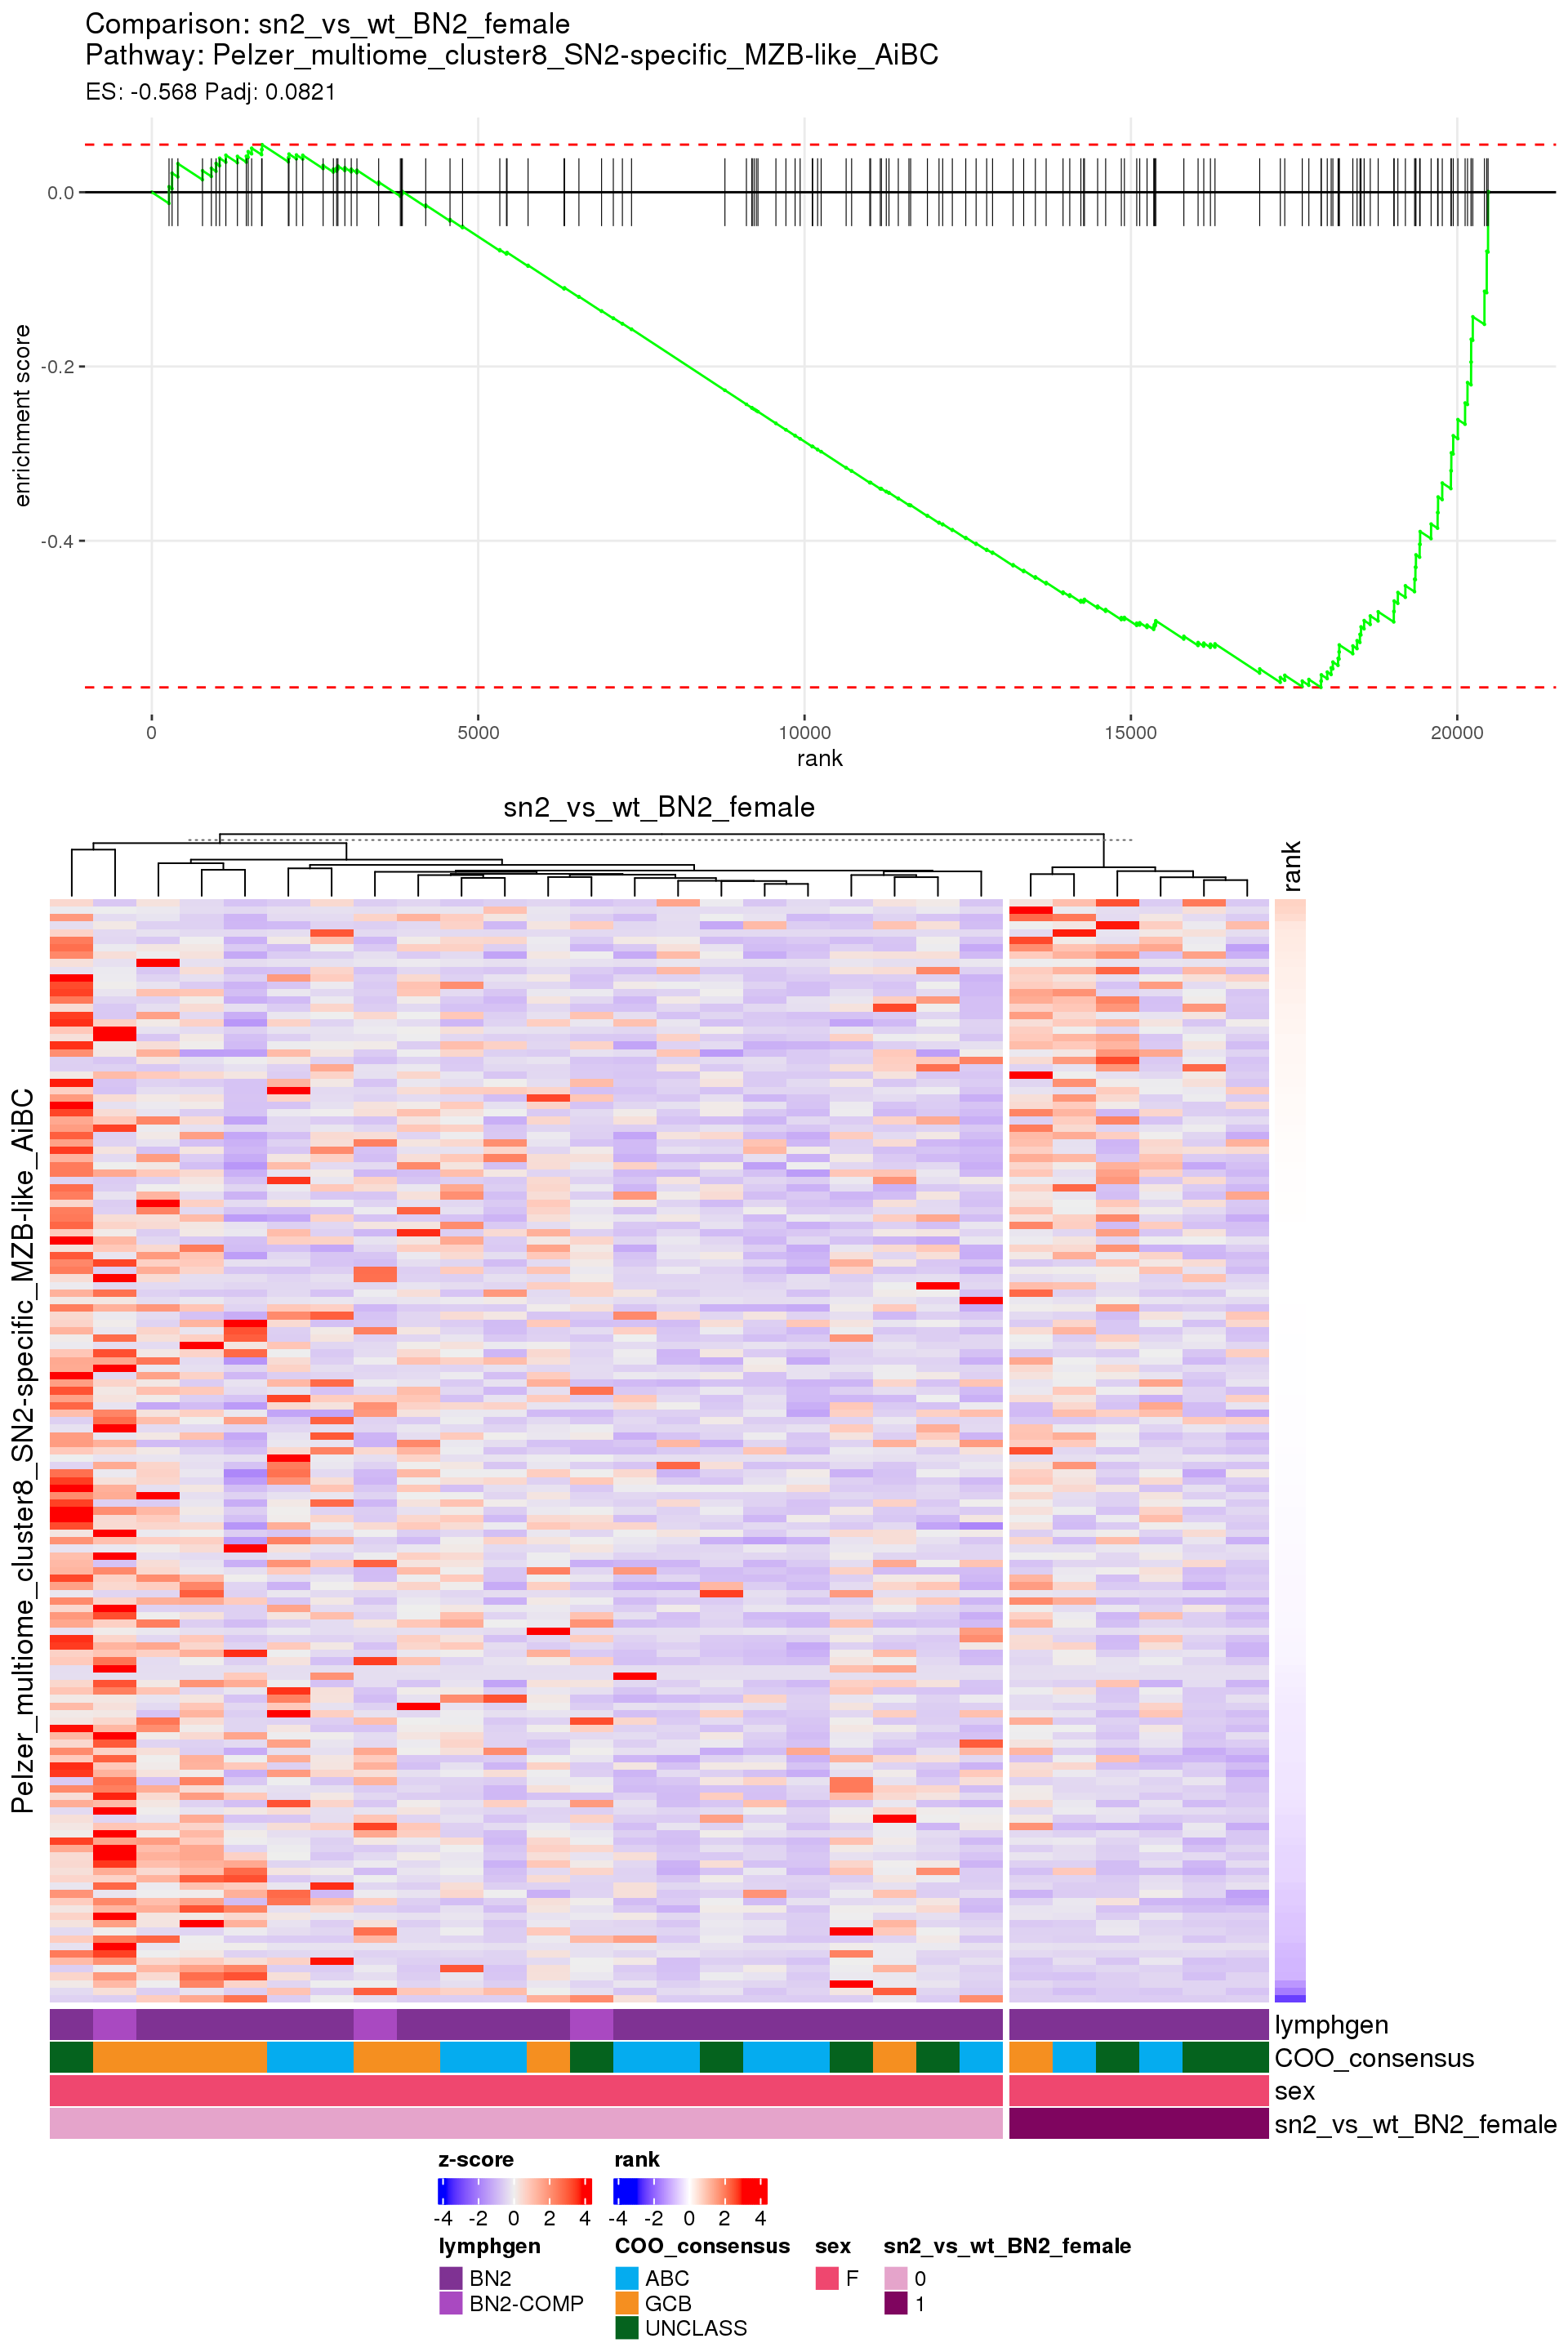
[1] "sn2_vs_wt_BN2_female"
0 1
33 9
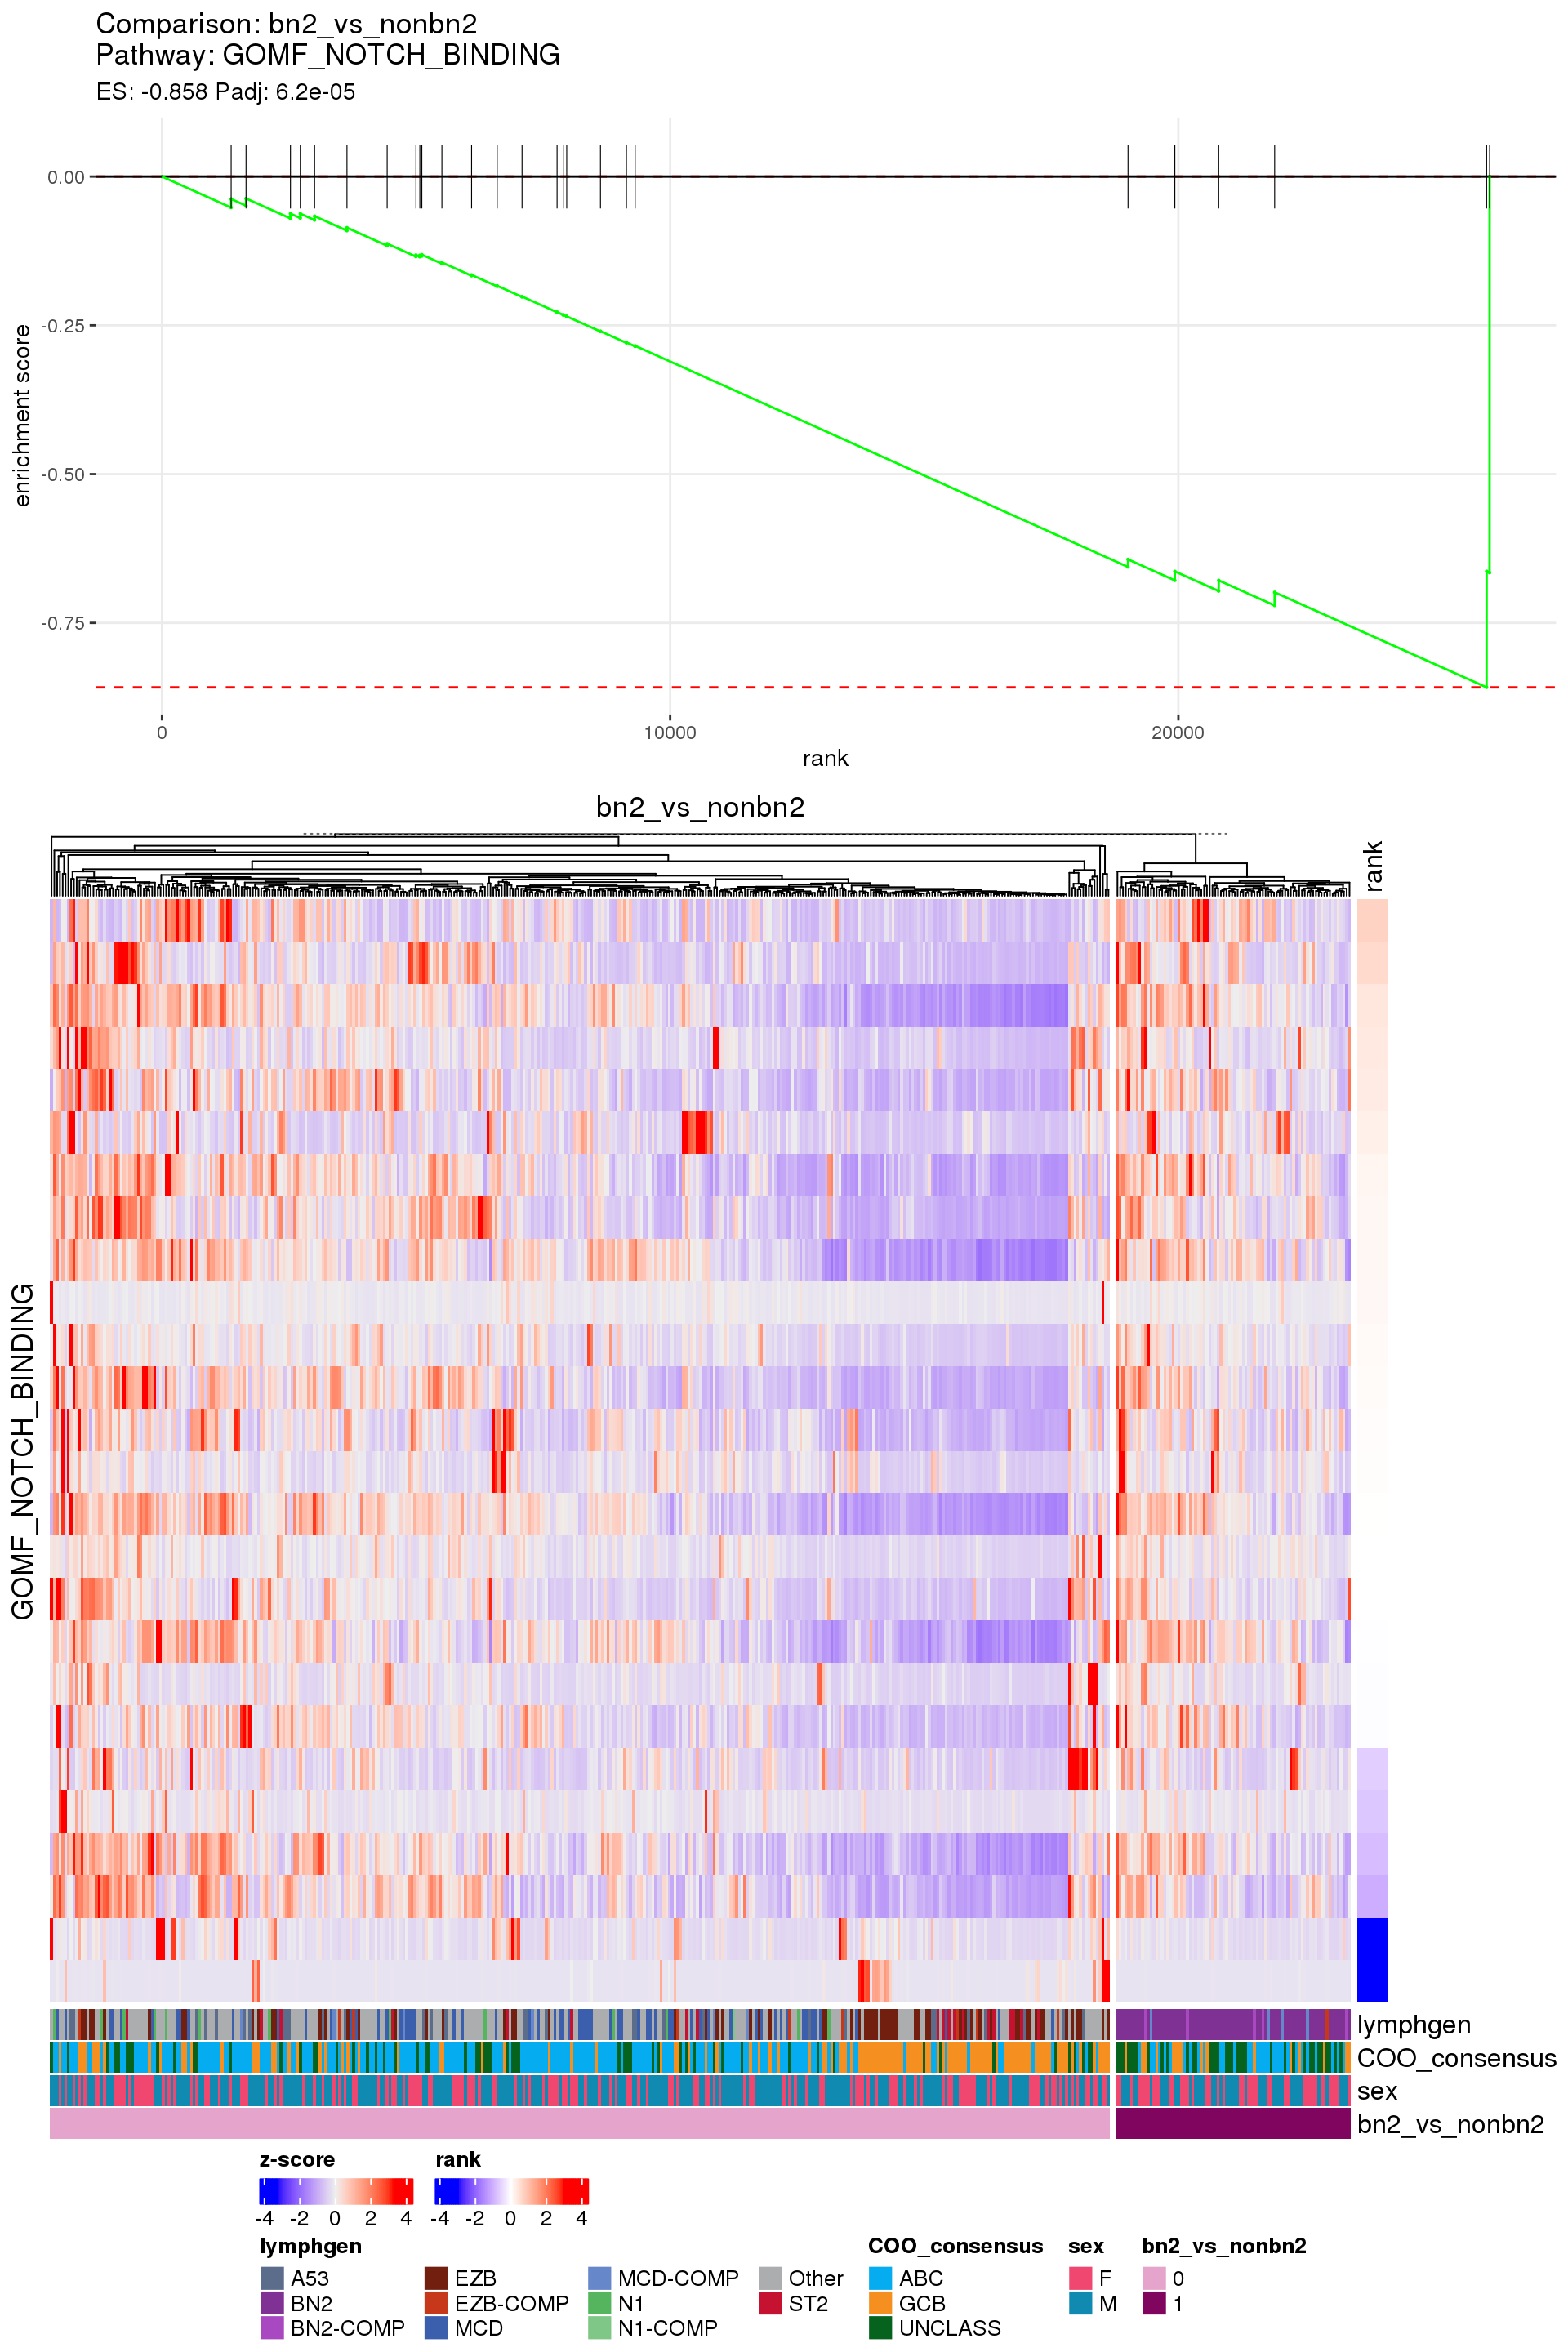
[1] "bn2_vs_nonbn2"
0 1
546 123
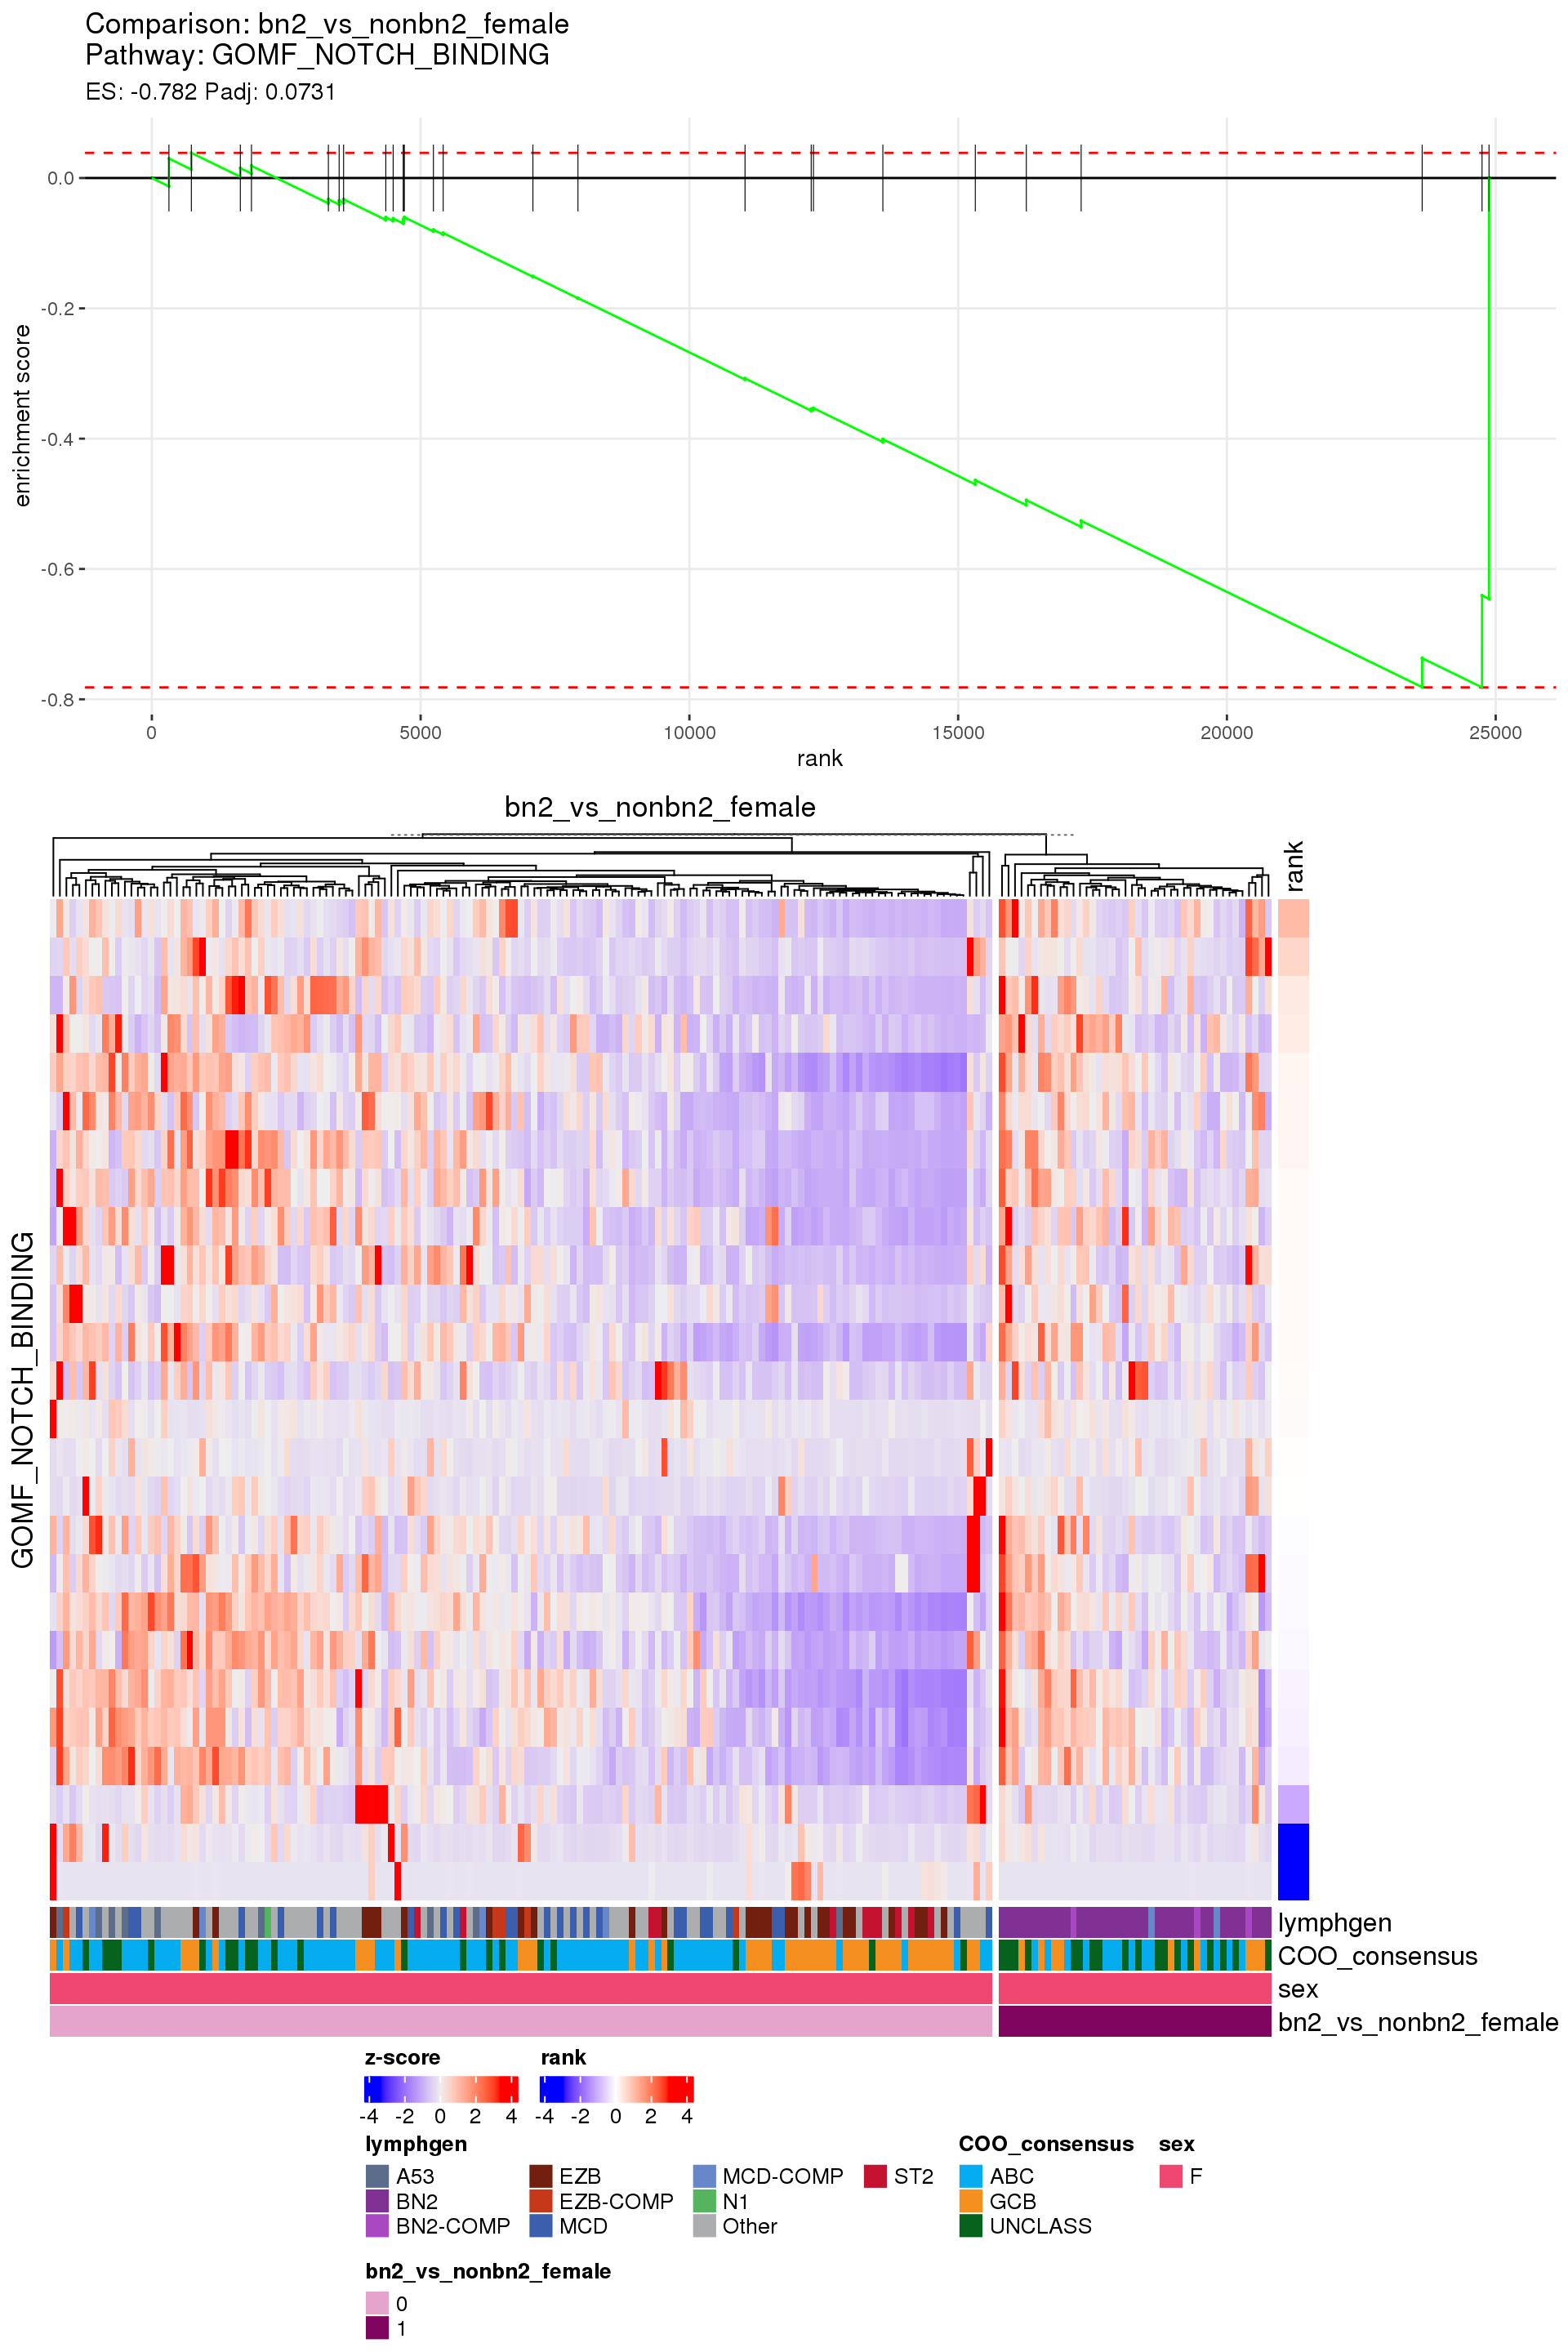
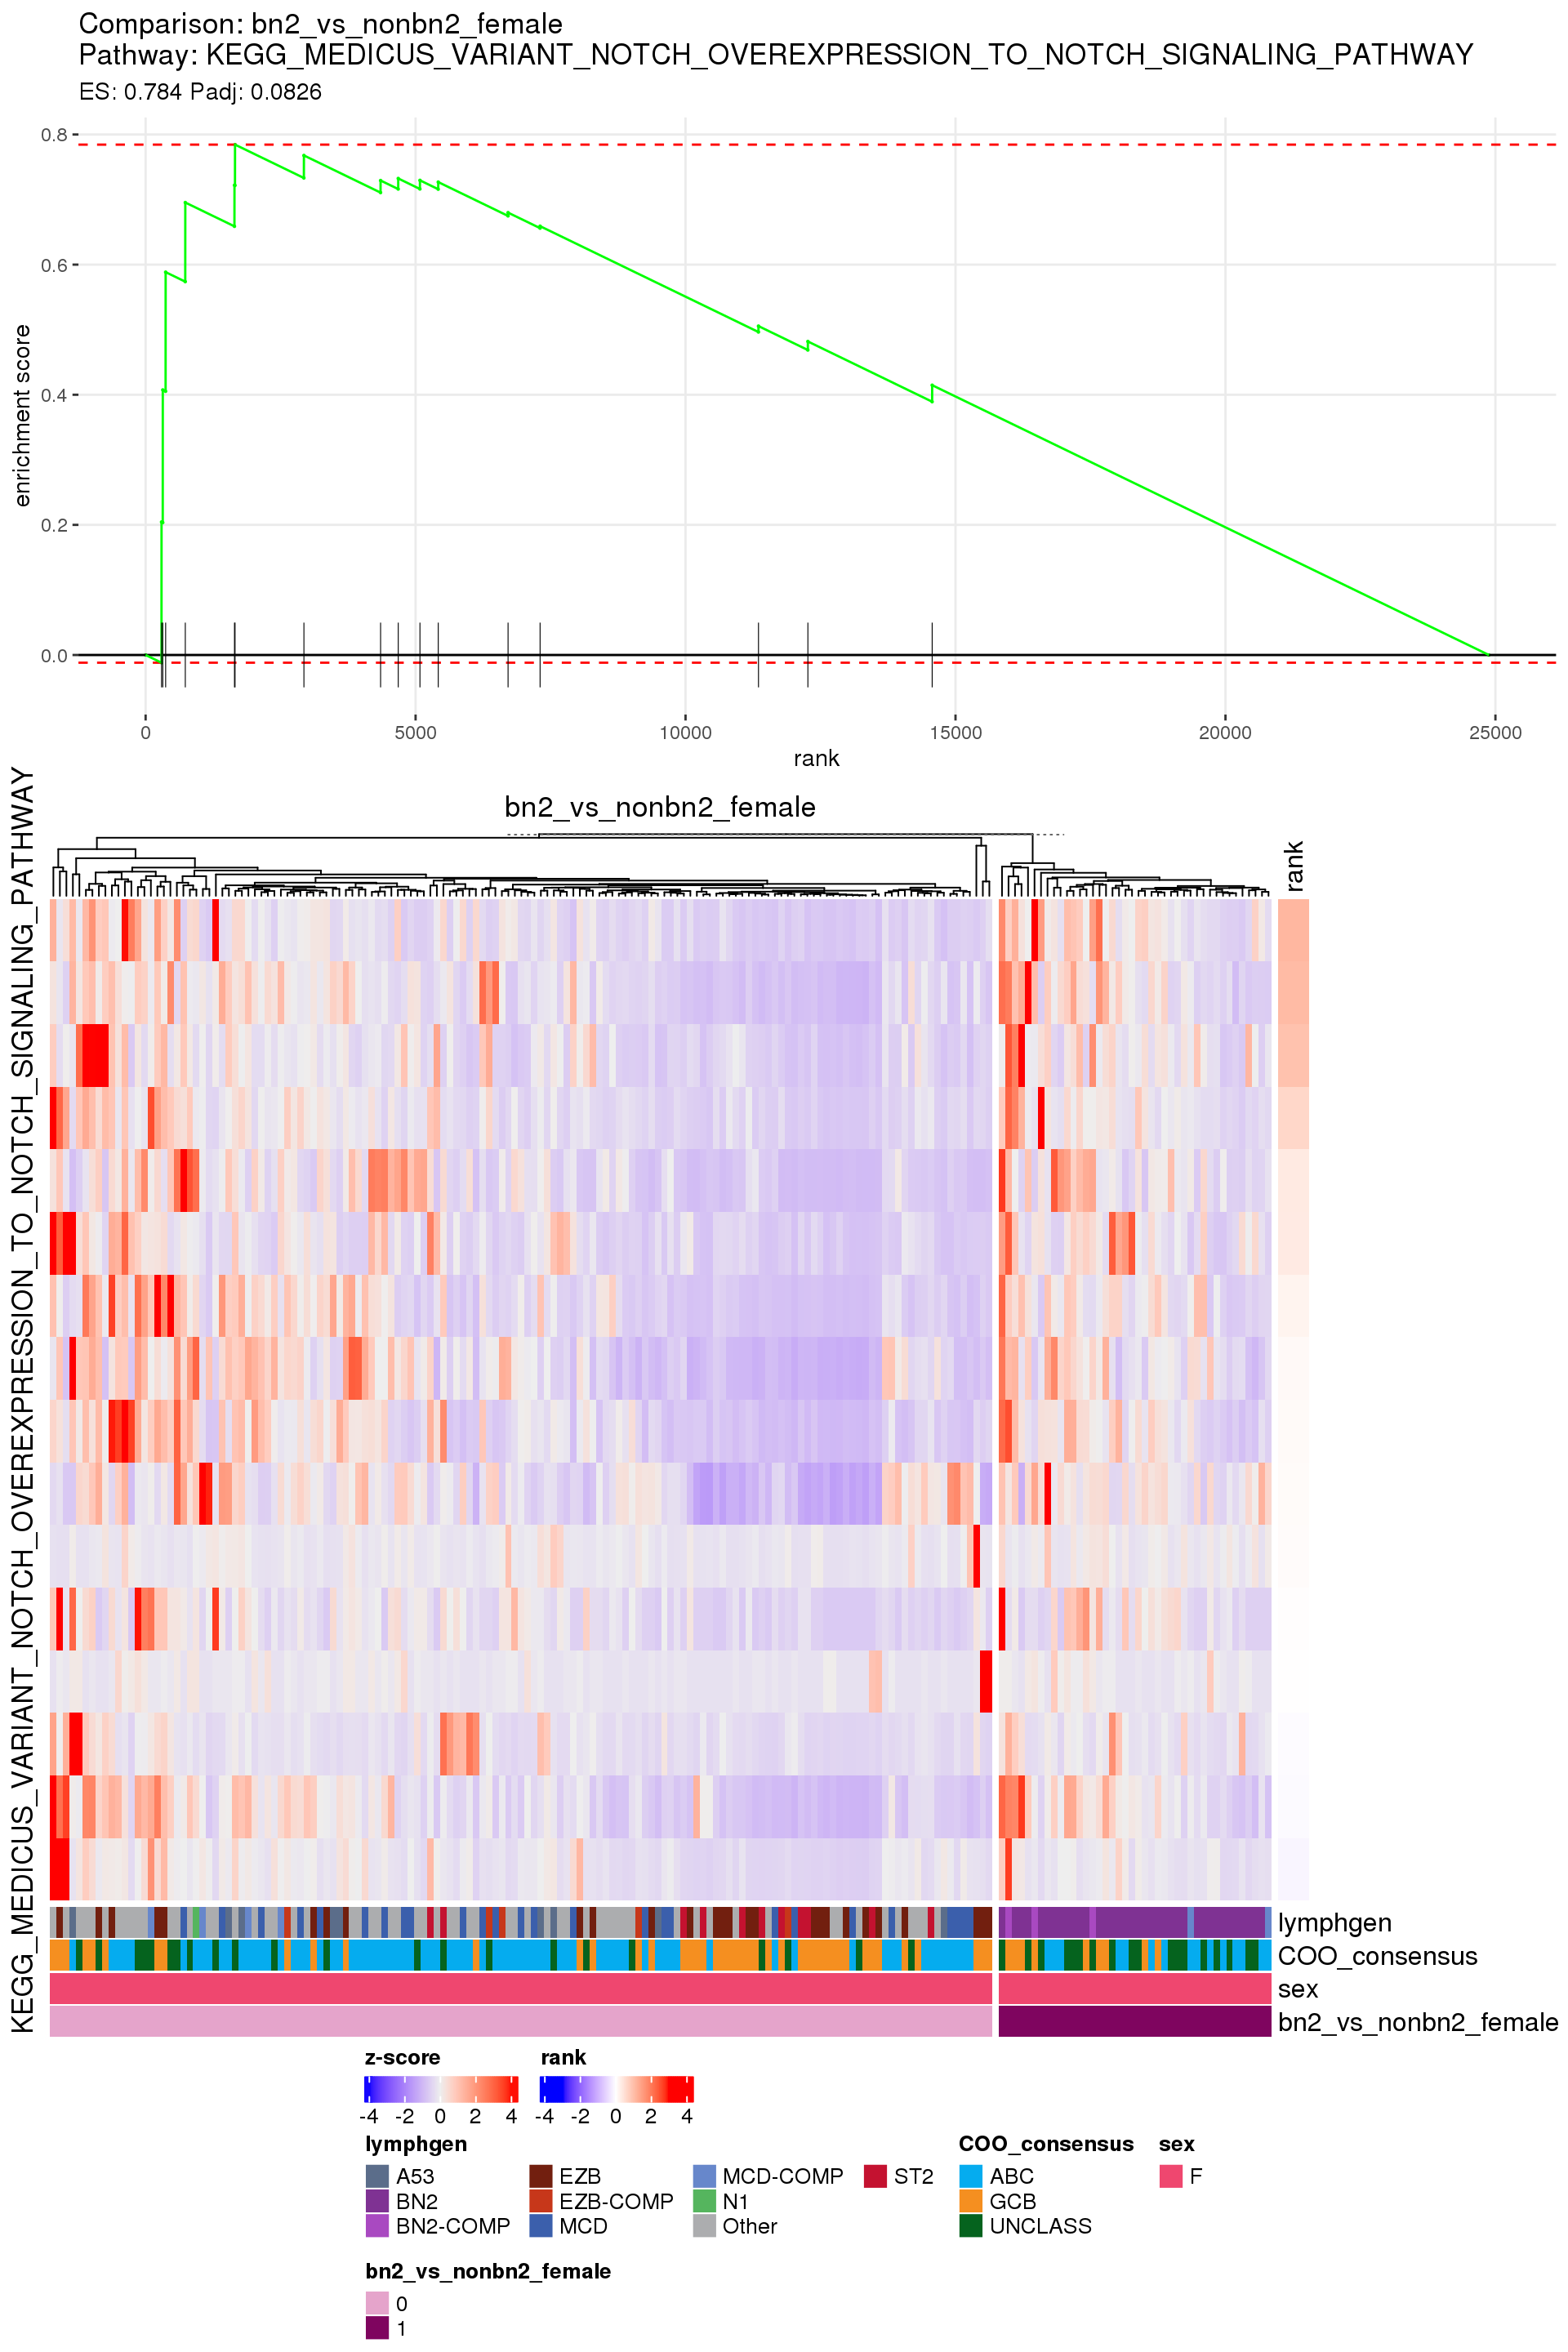
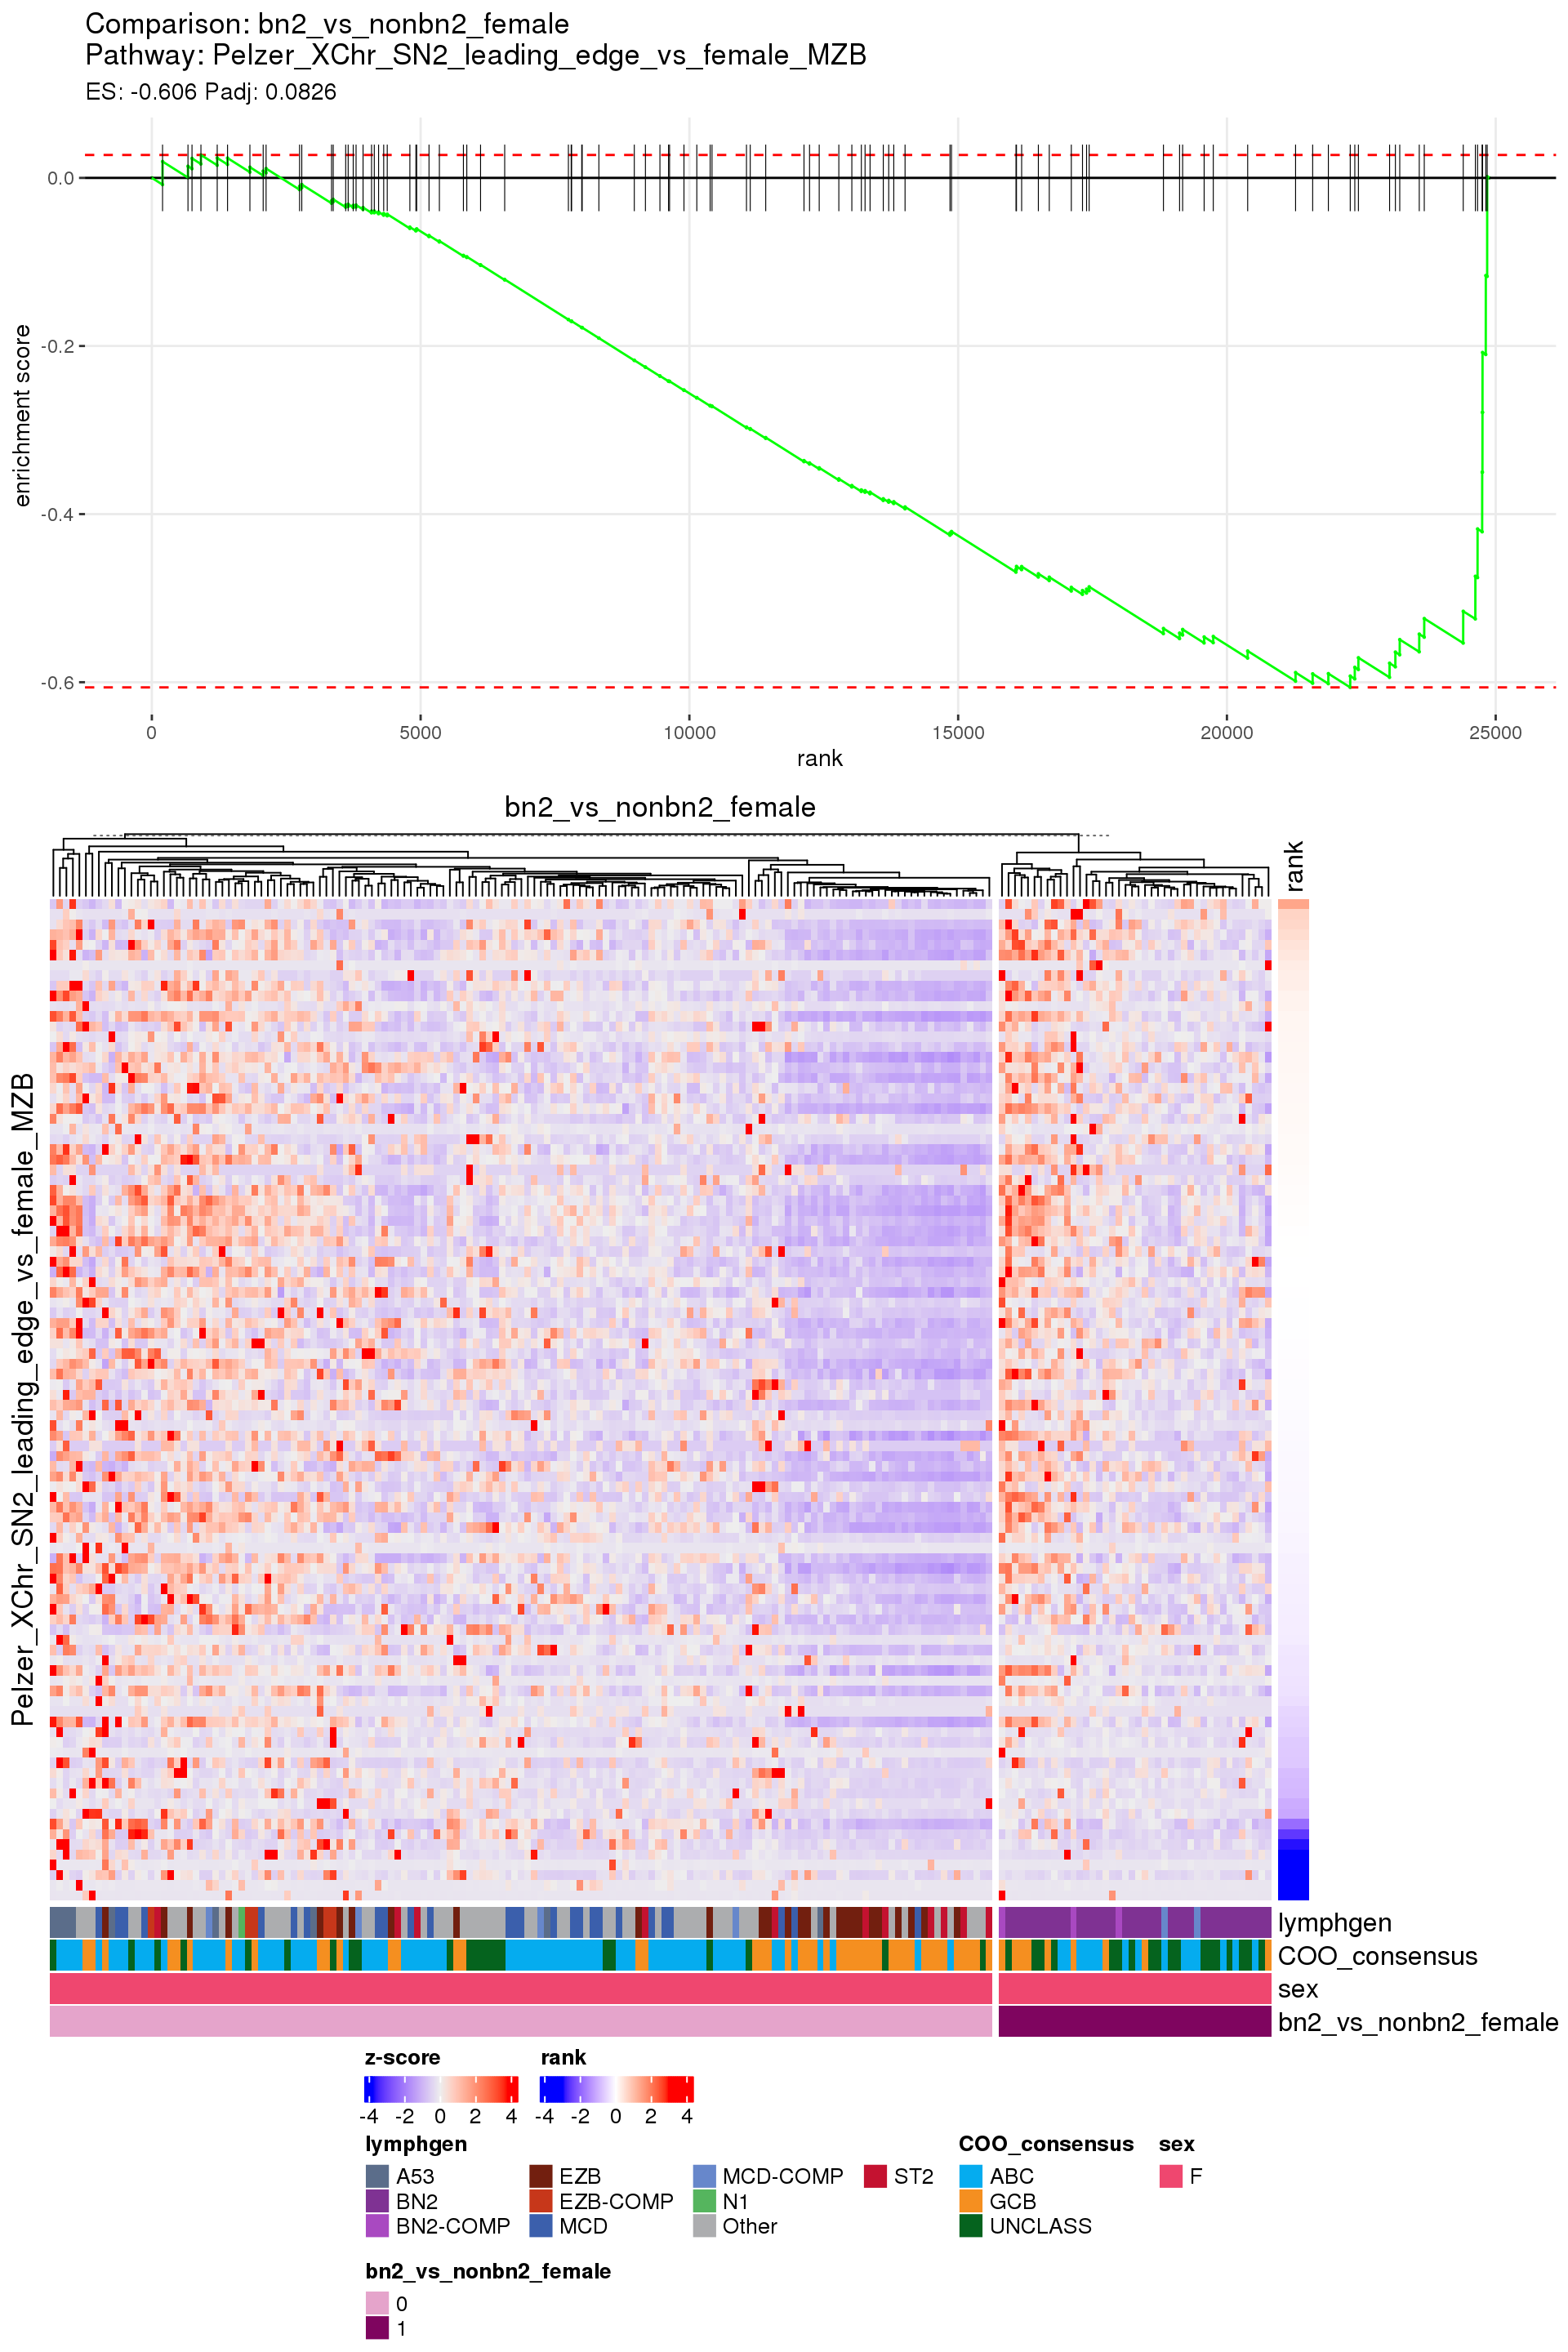
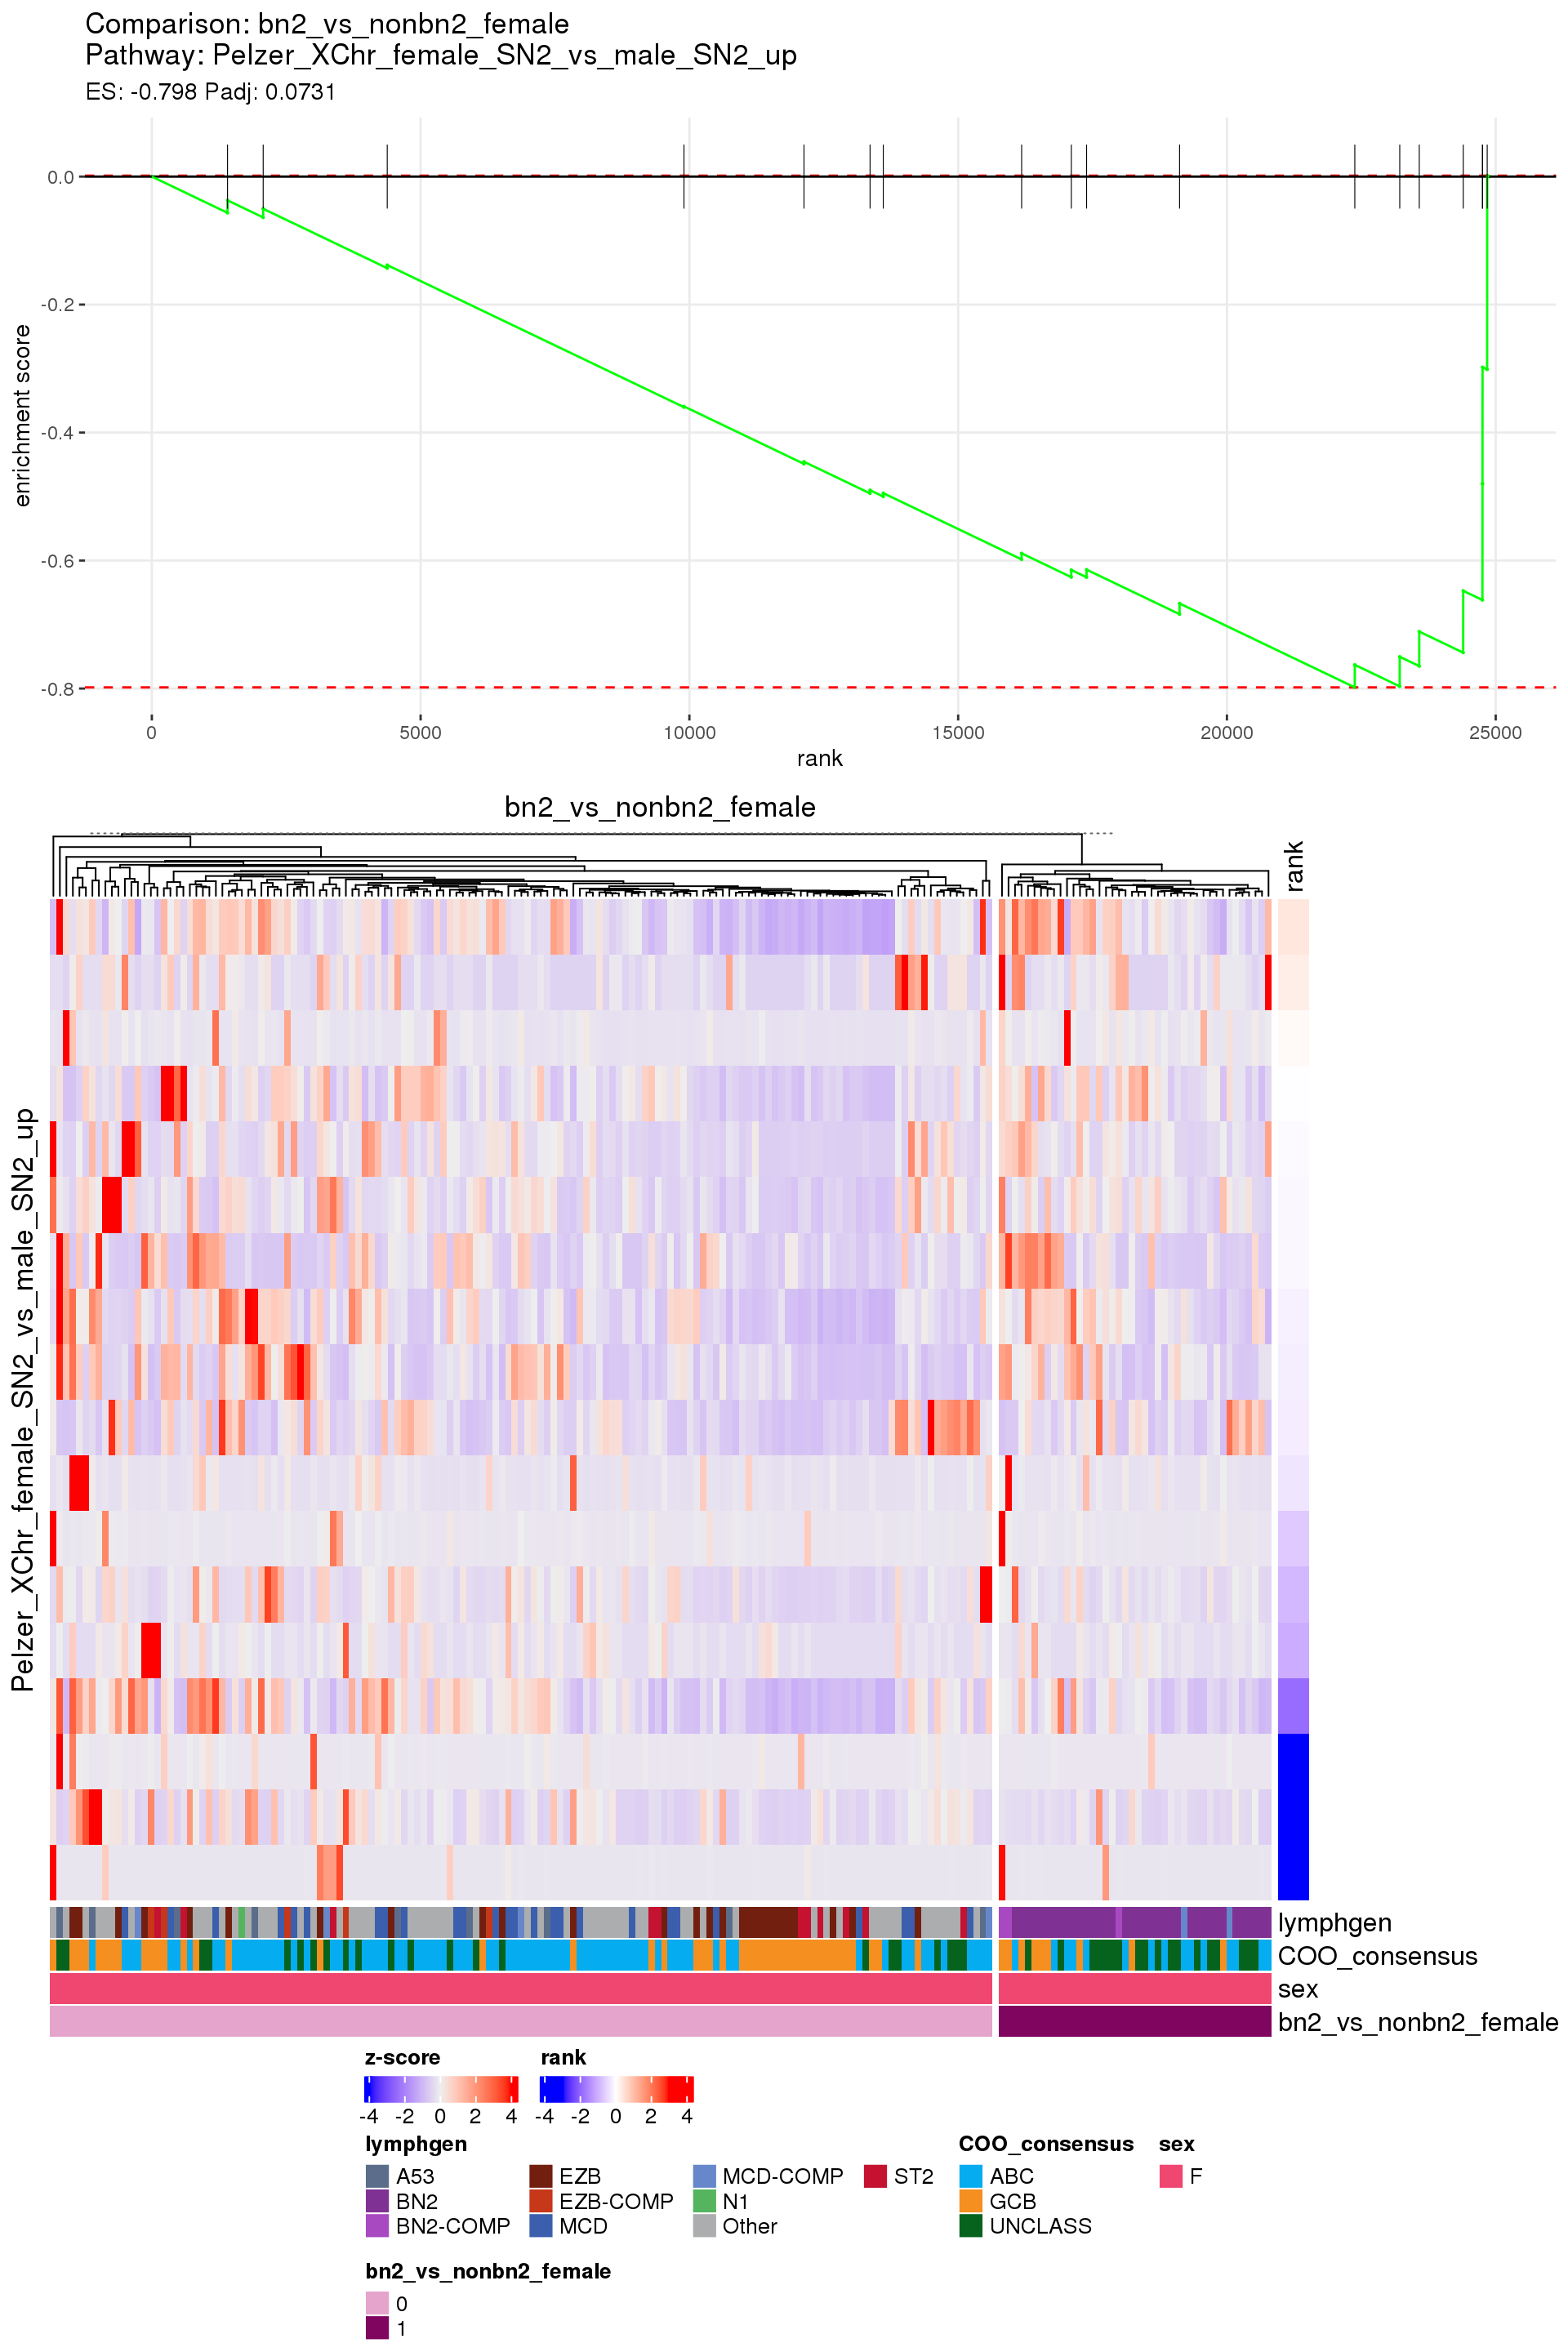
[1] "bn2_vs_nonbn2_female"
0 1
202 60
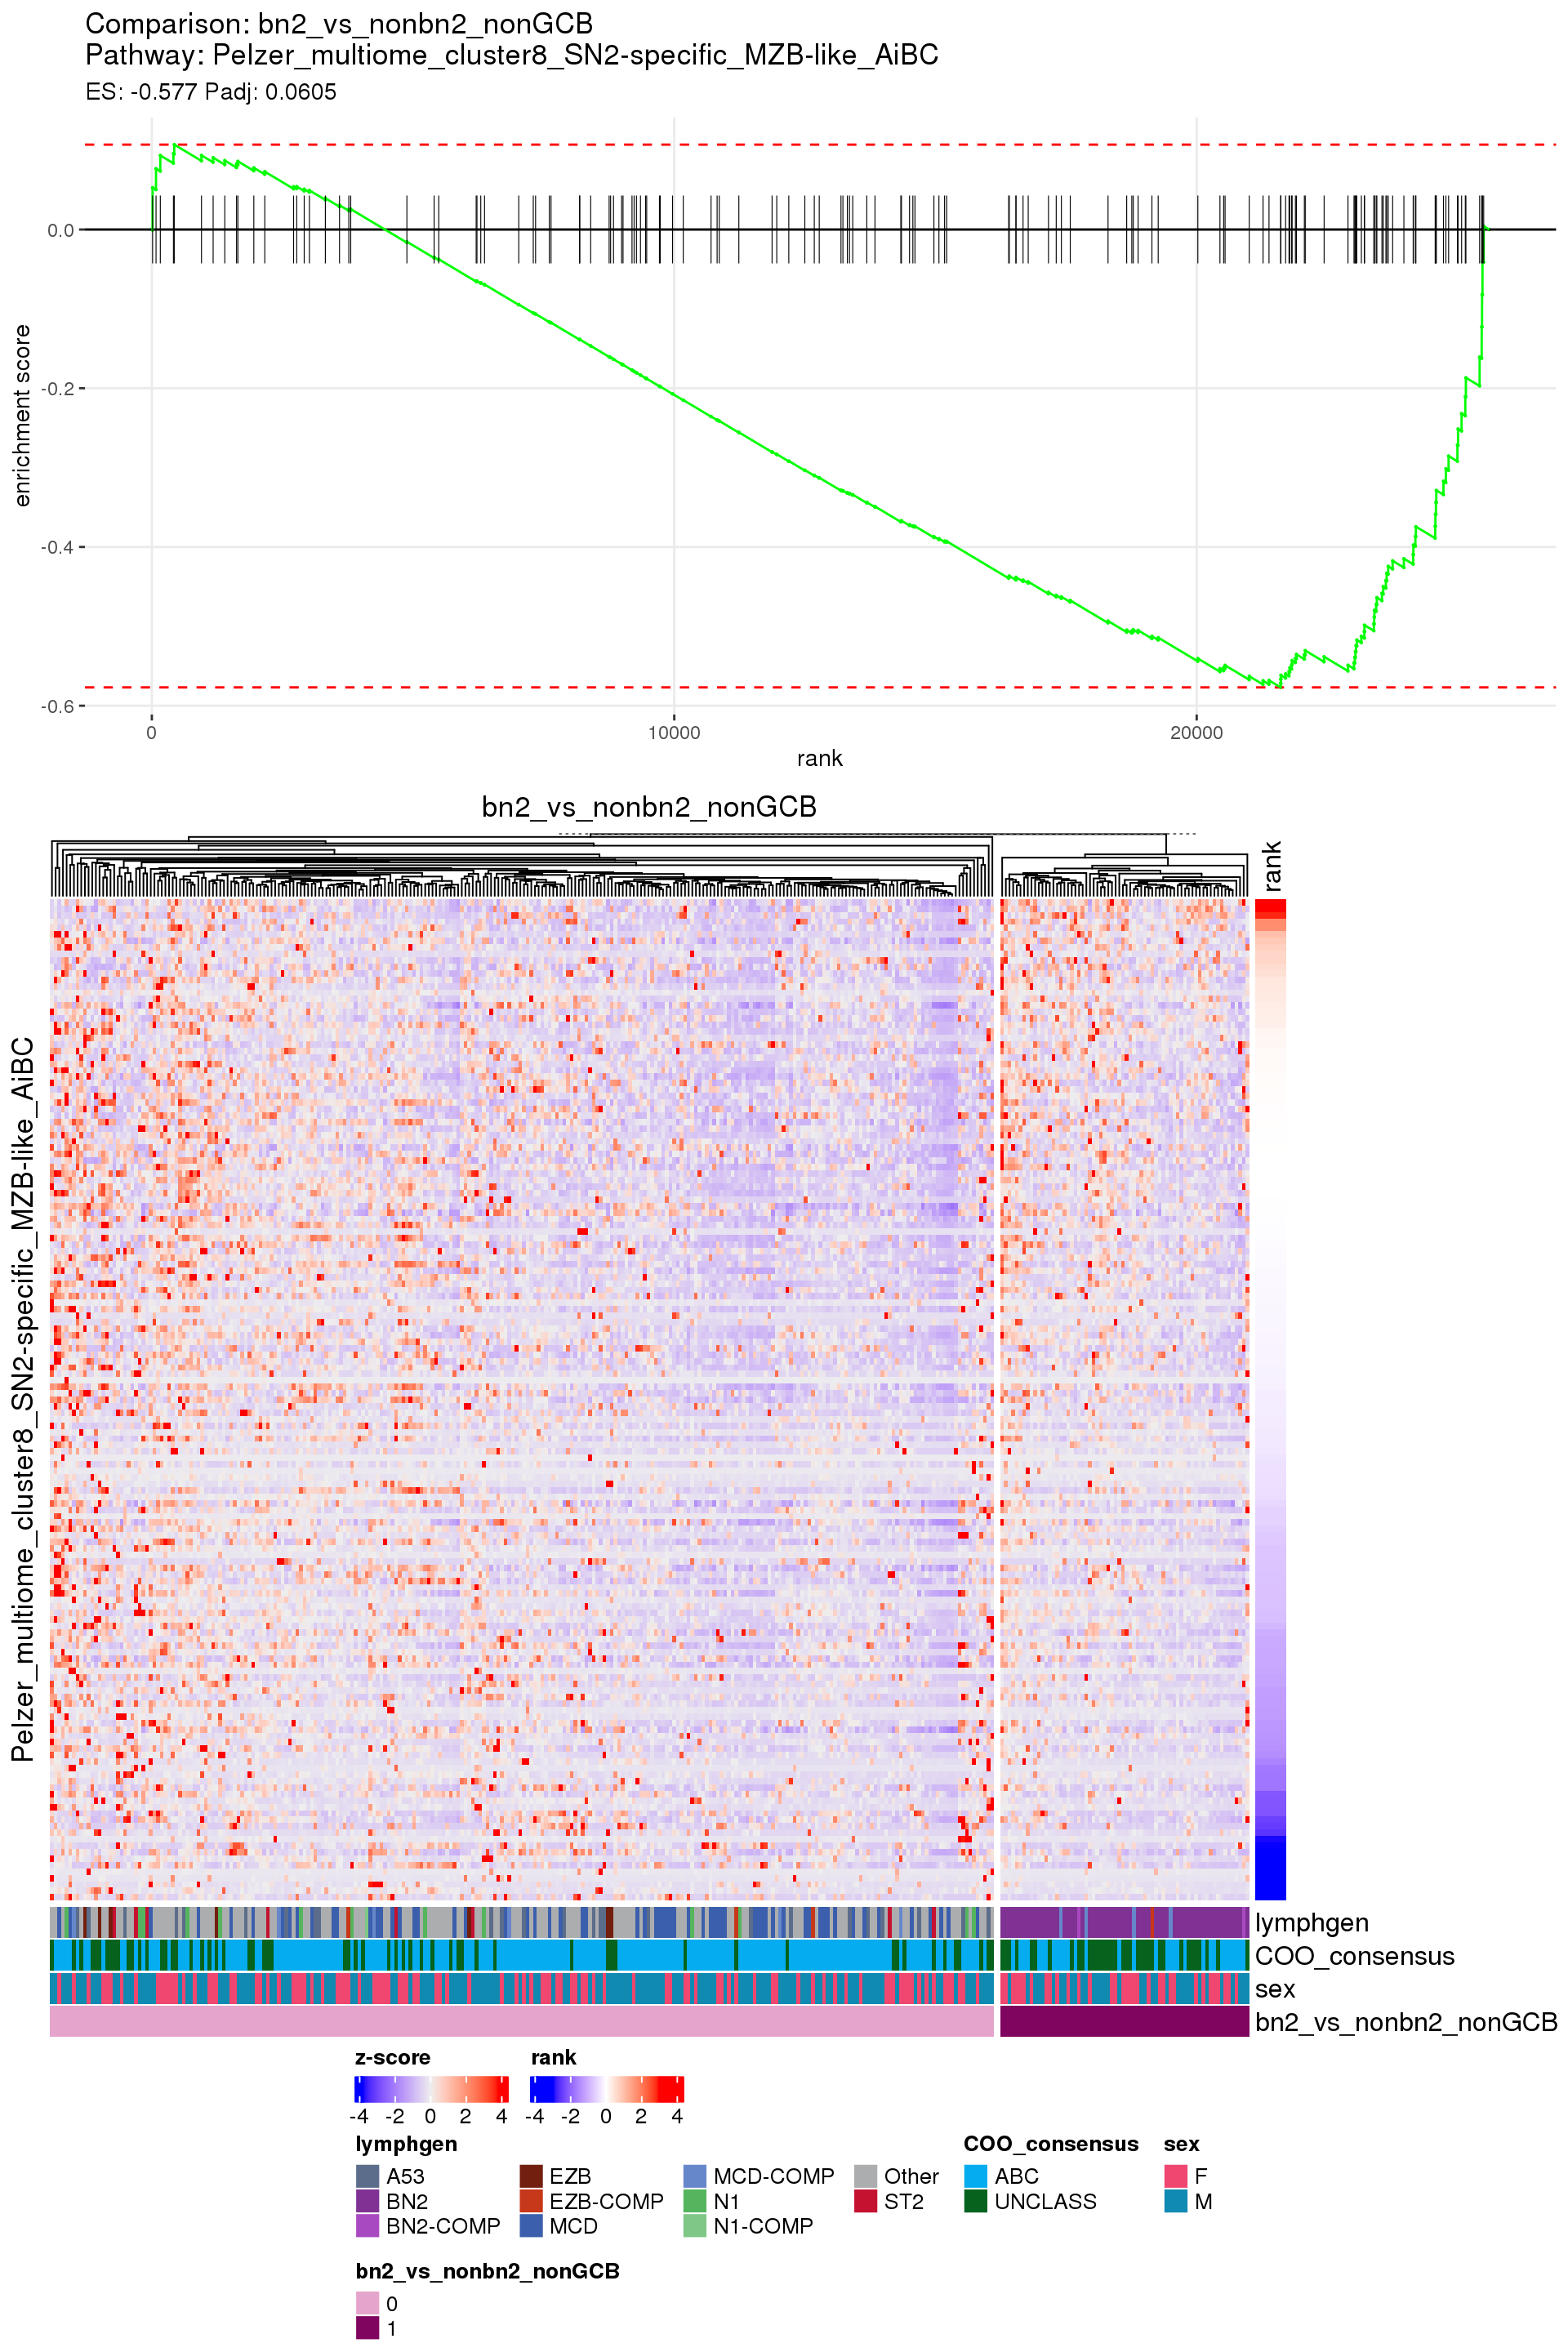
[1] "bn2_vs_nonbn2_nonGCB"
0 1
326 91
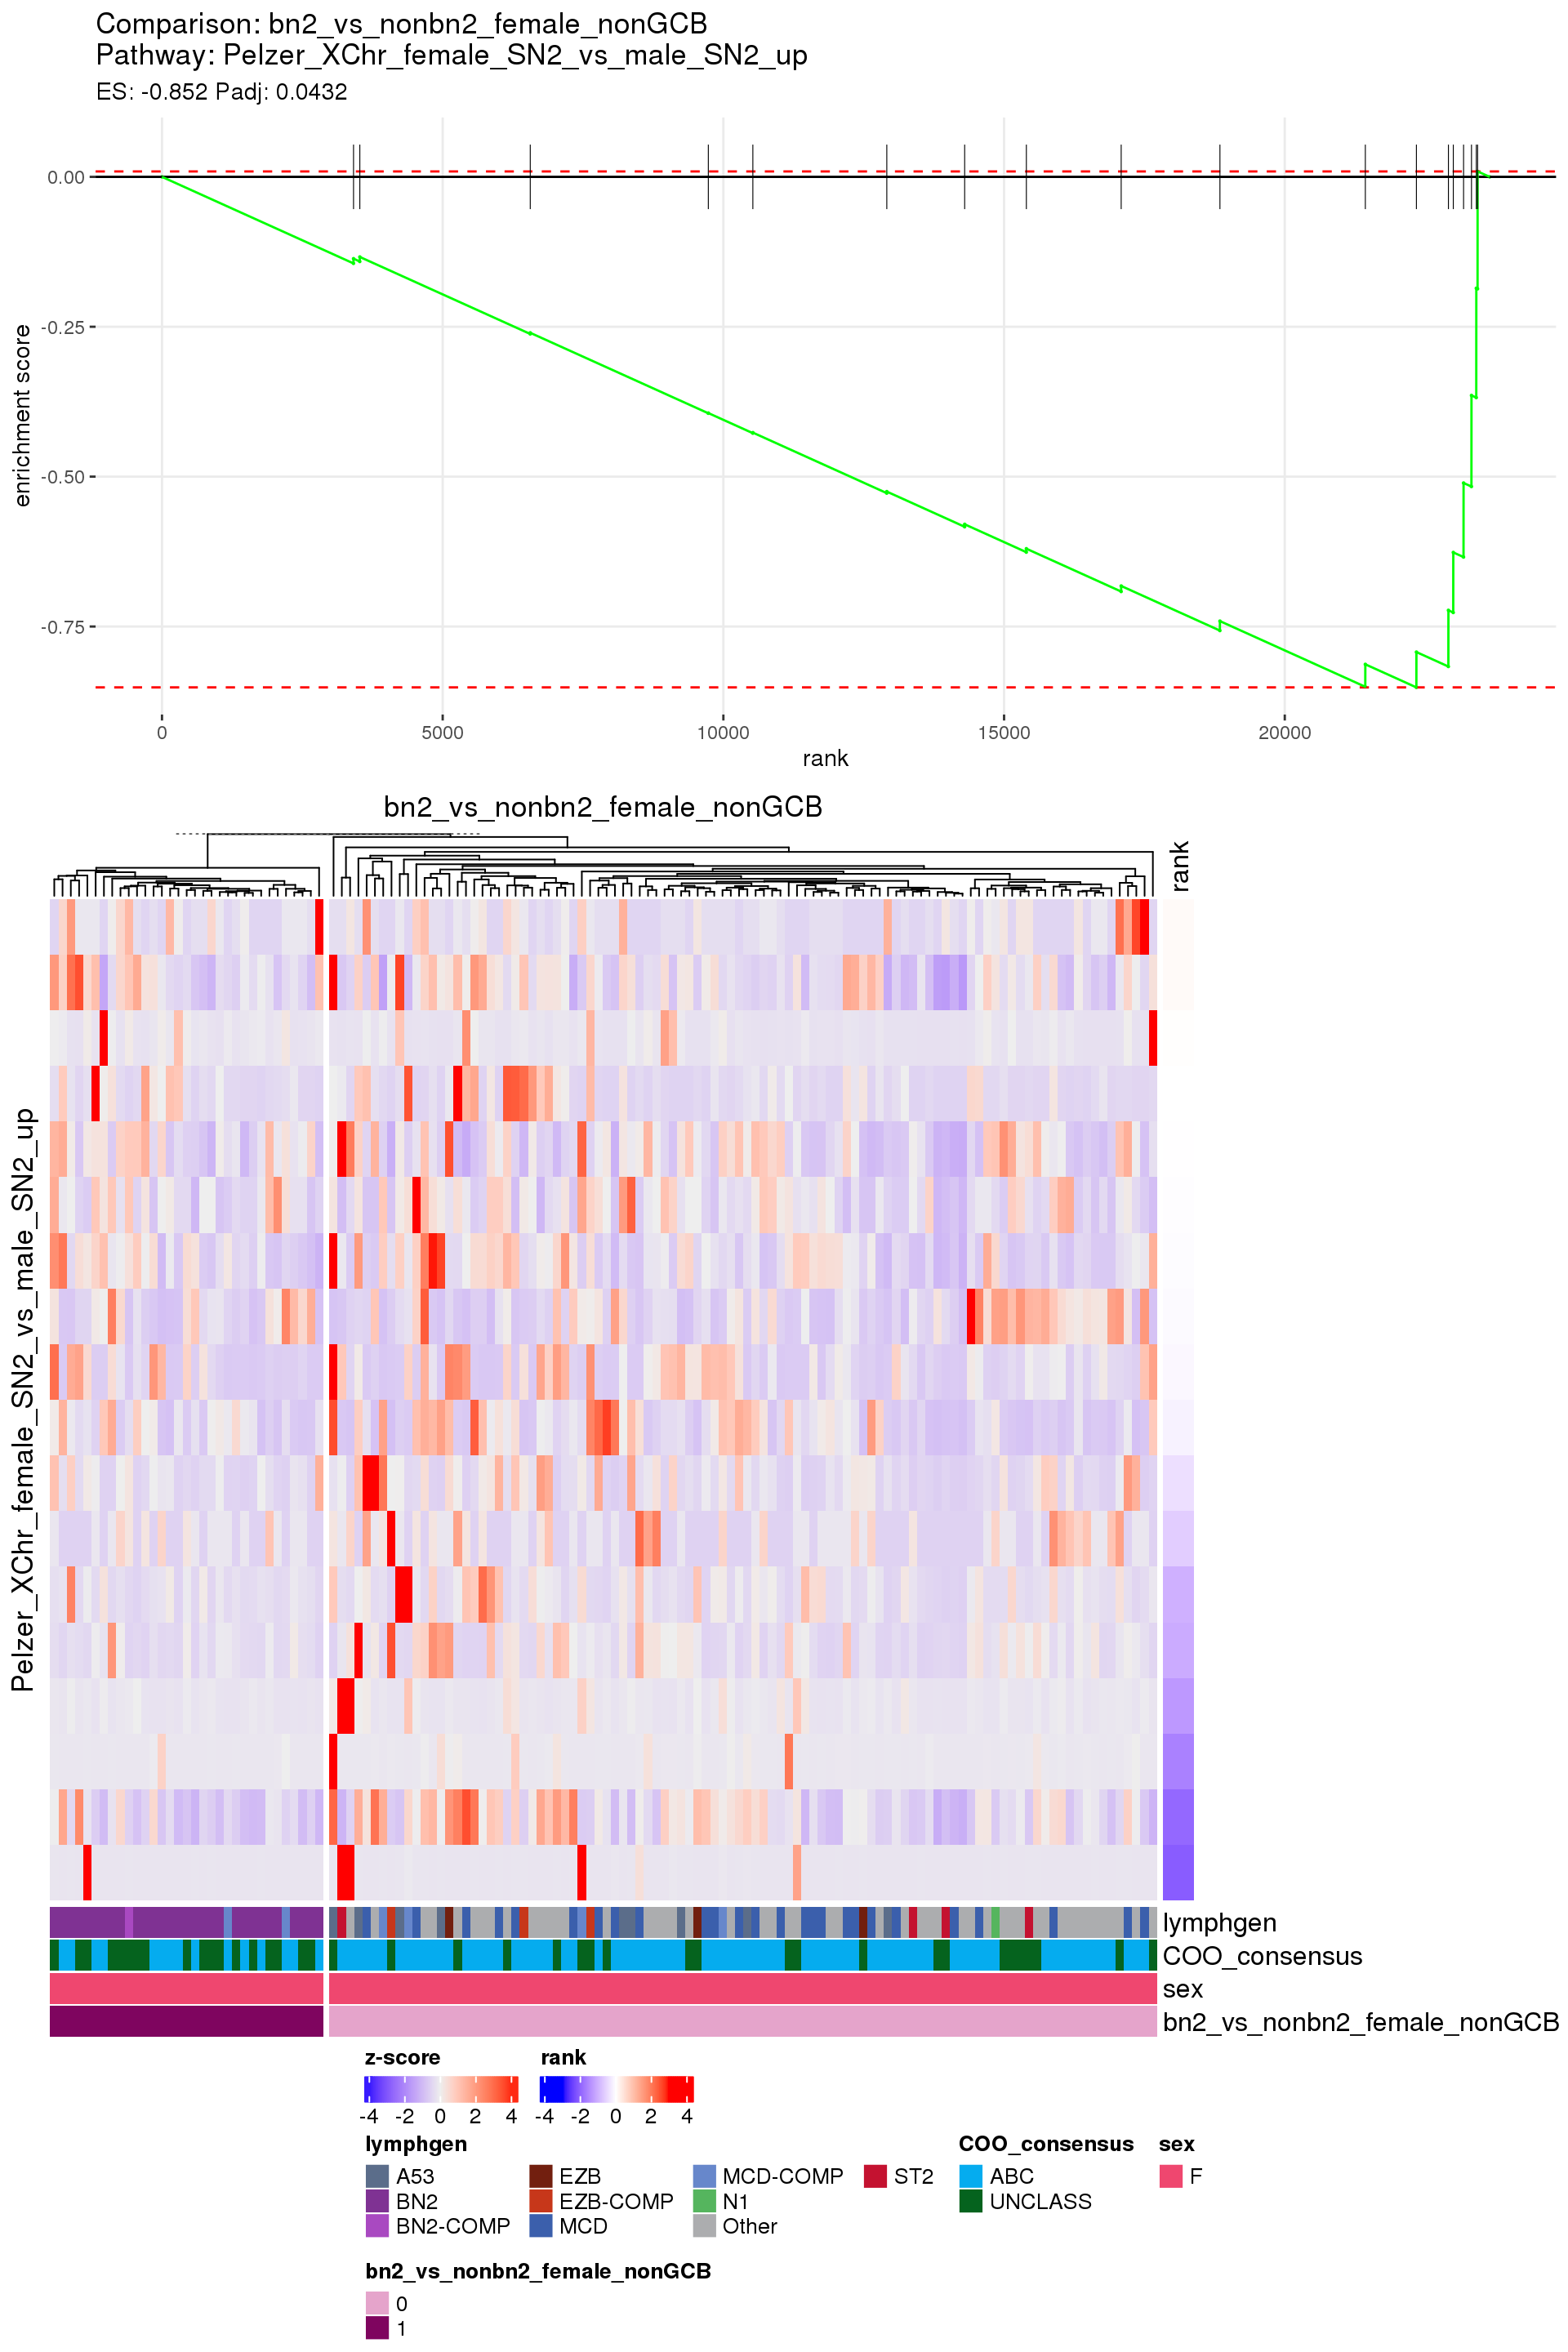
[1] "bn2_vs_nonbn2_female_nonGCB"
0 1
126 43 | cohort | preservation | protocol | n |
|---|---|---|---|
| DLBCL_Gascoyne | cell_suspension | PolyA | 1 |
| DLBCL_LSARP_Trios | FFPE | Ribodepletion | 1 |
| DLBCL_Marra | frozen_tissue | Ribodepletion | 1 |
| dlbcl_schmitz | frozen_tissue | PolyA | 8 |
Table 3 shows that including tumours outside of the Schmitz cohort will introduce batch effects related to tissue preservation and RNAseq protocol. To reduce the chance that these batch effects conceal true biological signal, only the Schmitz cohort will be used for this analysis.
Several of the gene sets to be interrogated were generated from mouse RNAseq data. Ben provided a table to convert the mouse gene names to human gene names, but some of the mouse genes do not have a human ortholog. The list of mouse genes without a human ortholog is provided in SN2_signatures_data/mouse_genes_no_human.tsv, and this list includes 864 genes.
[1] TRUEIn the end, few comparisons had any significant pathway enrichment. Pathways were only found to be significantly enriched in the rankings based on padj, which included all genes regardless of significance, and nothing was significant based on log2FoldChange rankings, which excluded genes with padj > 0.1.