Comparison of genetic and gene expression classifications in data generated by BostonGene and MD Anderson
Background
The group of Dr. Chris Flowers at MD Anderson has generated whole exome an RNAseq data with BostonGene. In parallel, they have calibrated their own in-house DLBCL90 assay using 34 samples that were also run here at BC Cancer. The goal of this project is to compare the genetic and gene expression classifications of these samples.
Analysis
COO classification and RNAseq
BostonGene has developed their own method for COO classification from RNAseq data, which is only ~70% concordant with NanoString. Indeed, a significant number of cases appear to be frankly discordant. We will explore the RNAseq data to try to understand these discordant cases.
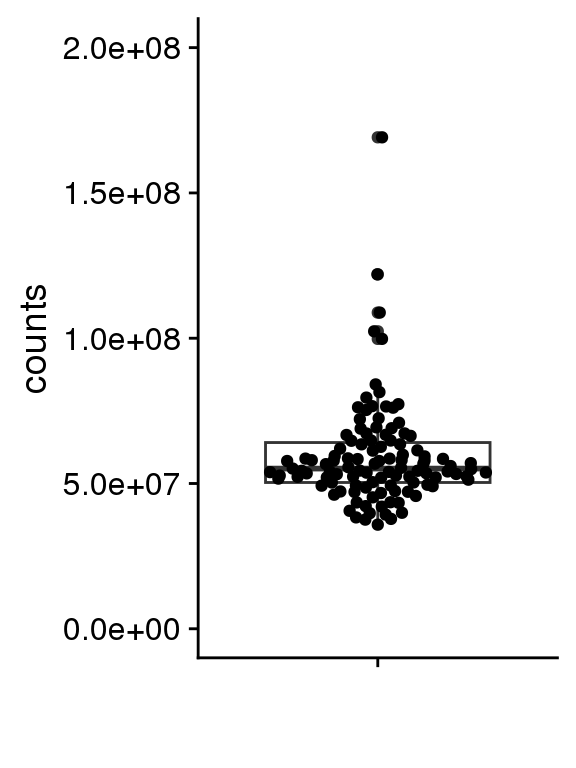
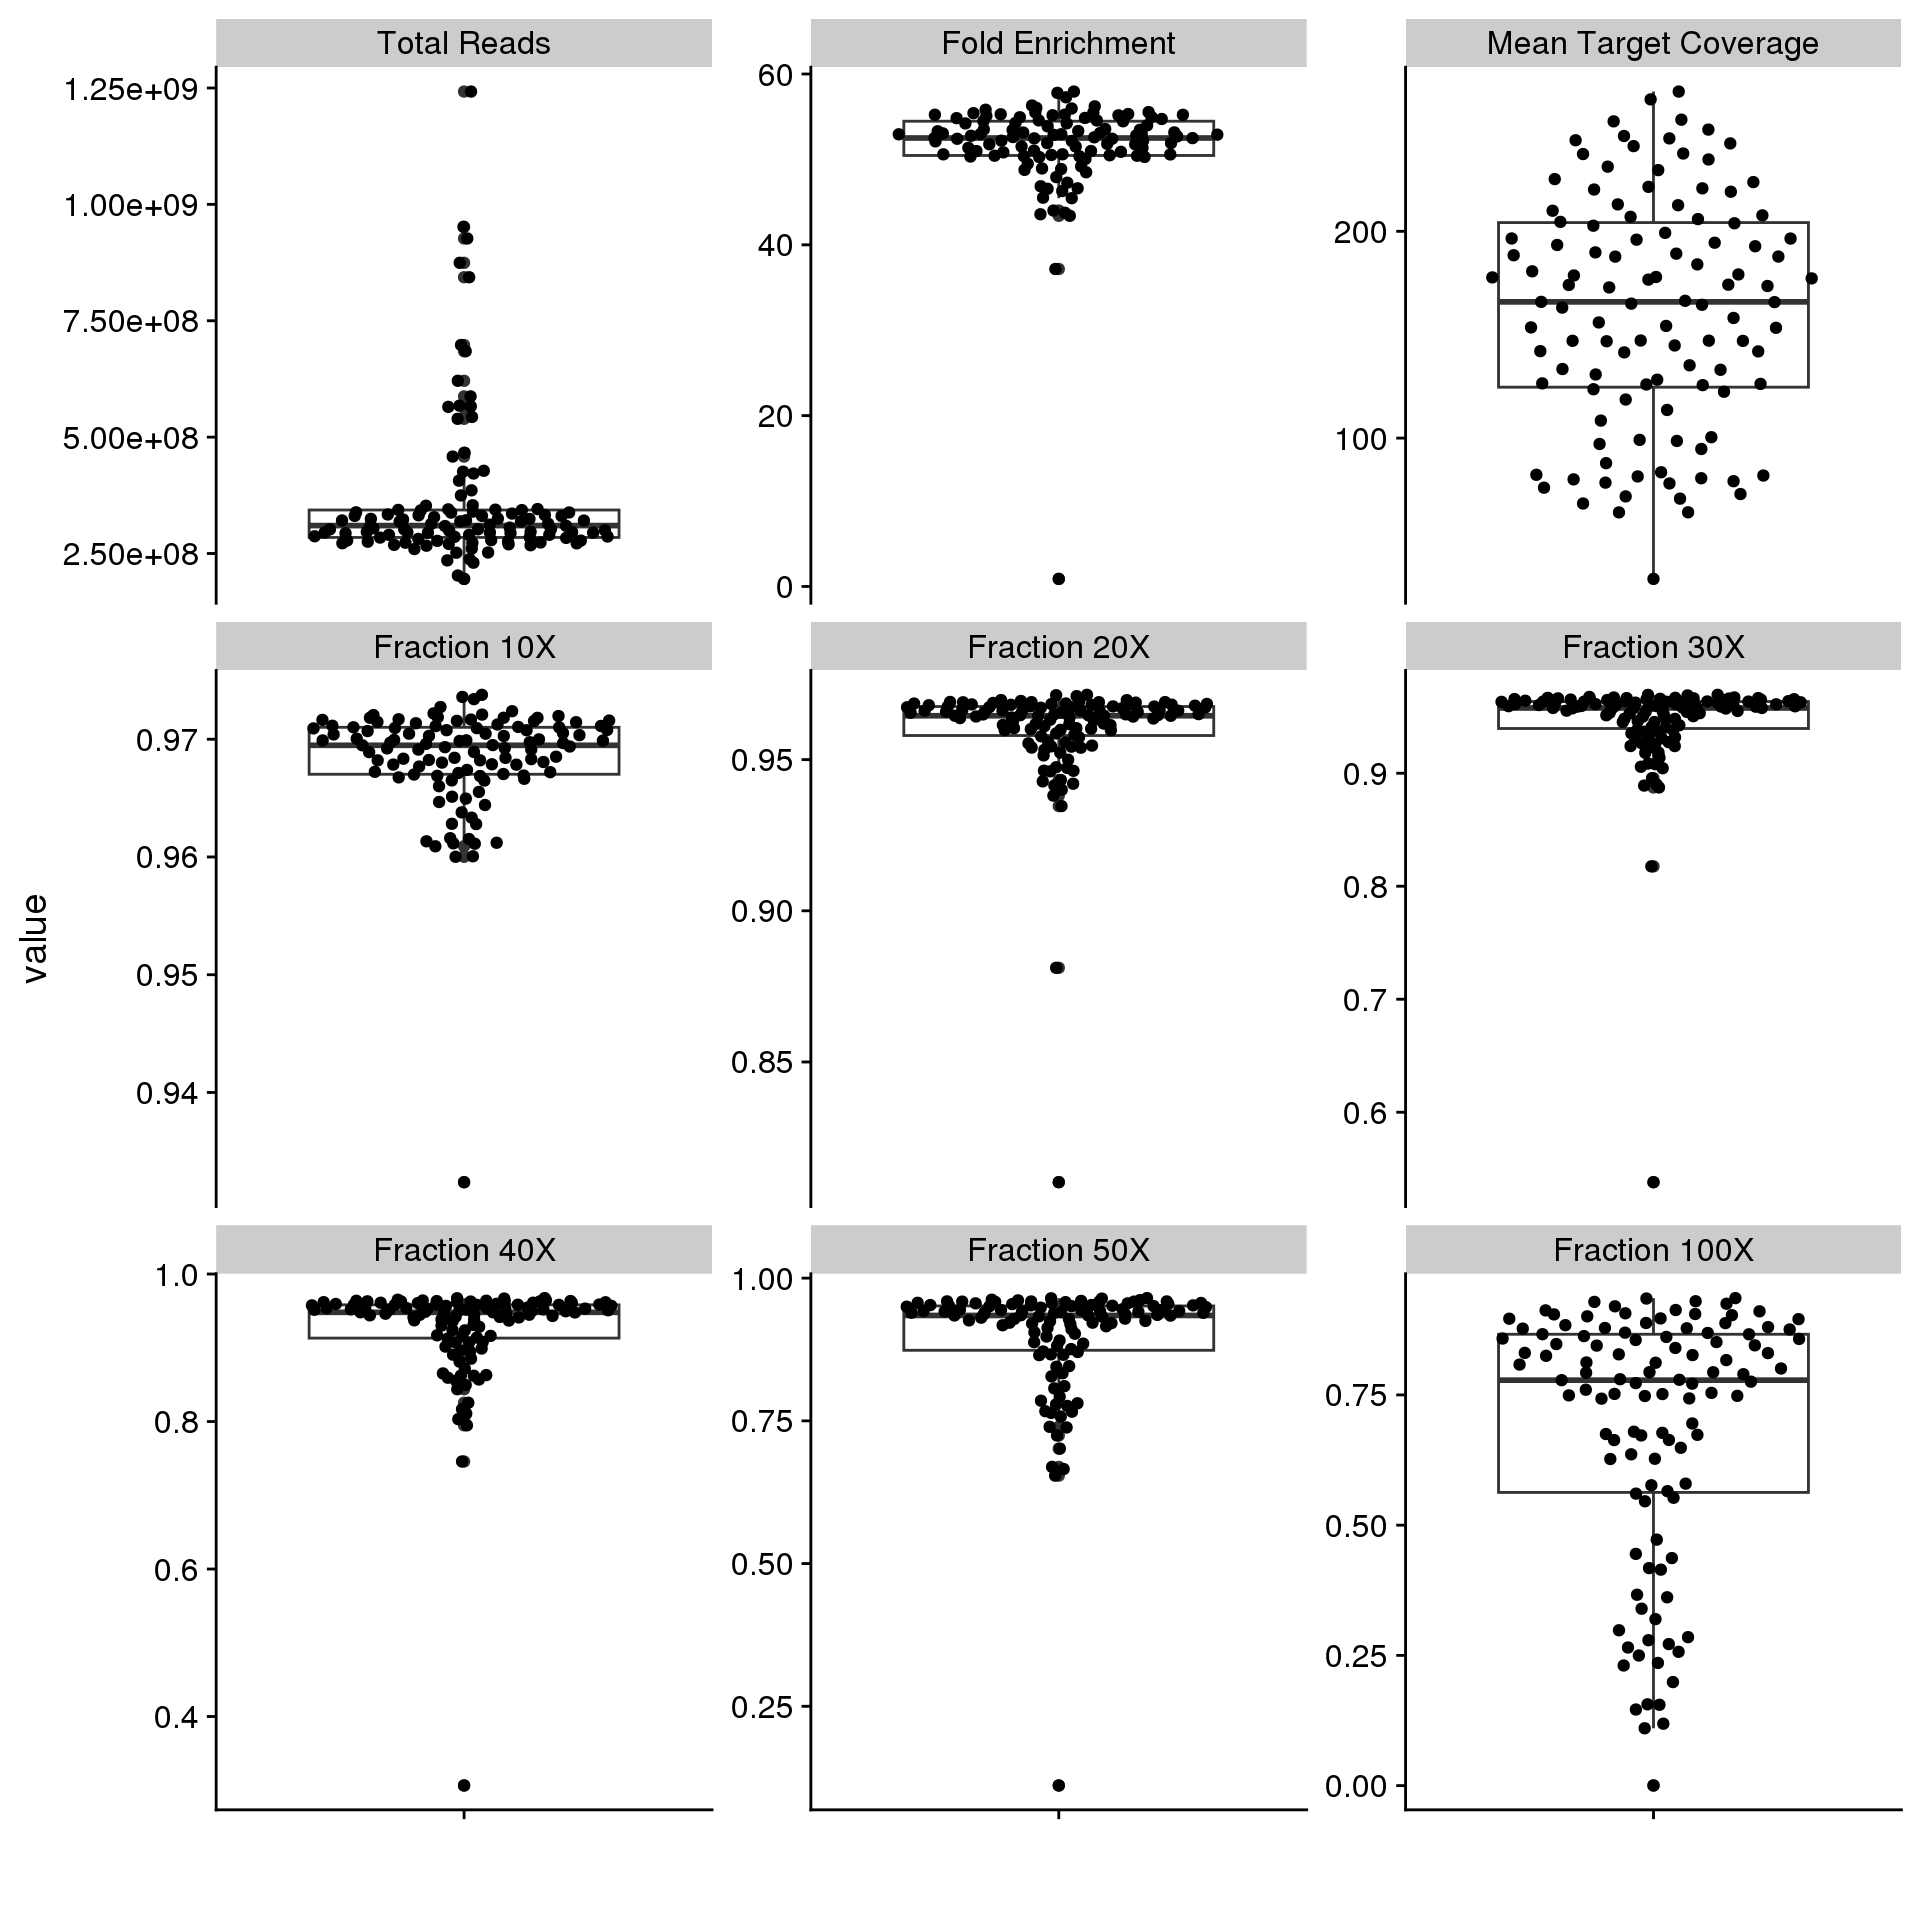
RNAseq data were pseudo-aligned to the hg38 Gencode v33 transcriptome with Salmon to generate read counts per gene. Figure 1 shows that the RNAseq data is good quality, with at least 35 M transcriptome-mapped reads per sample.
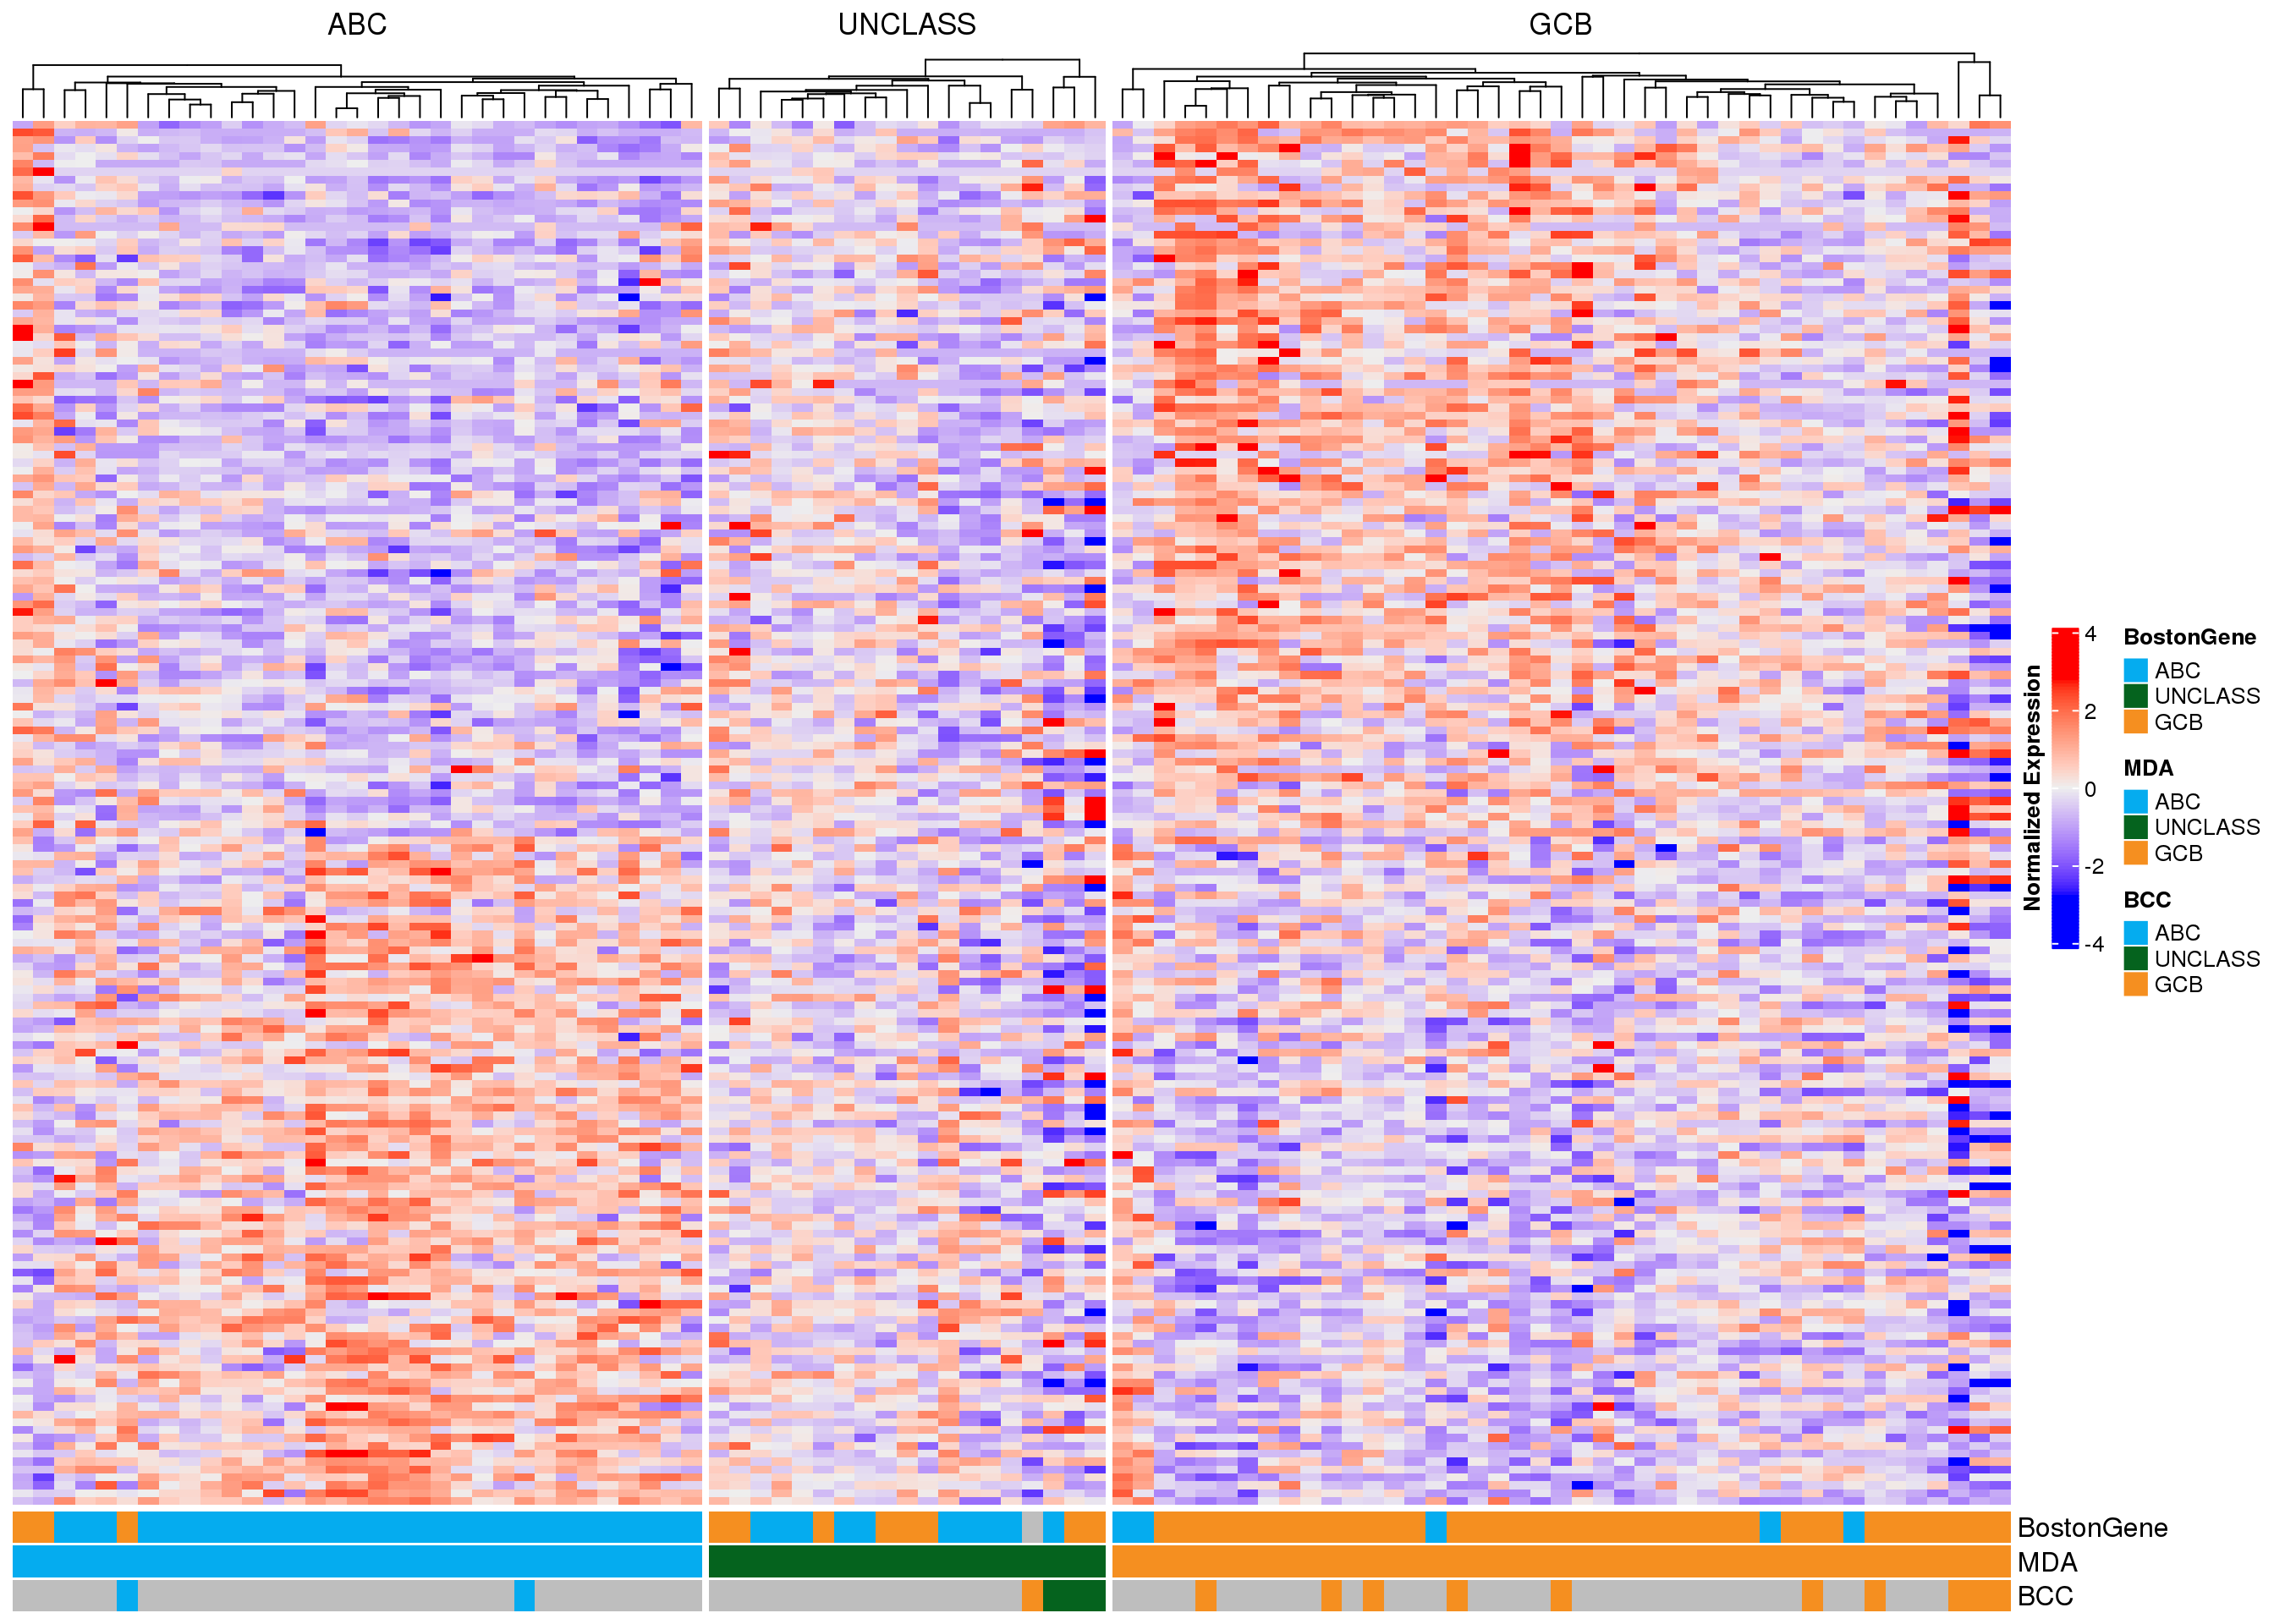
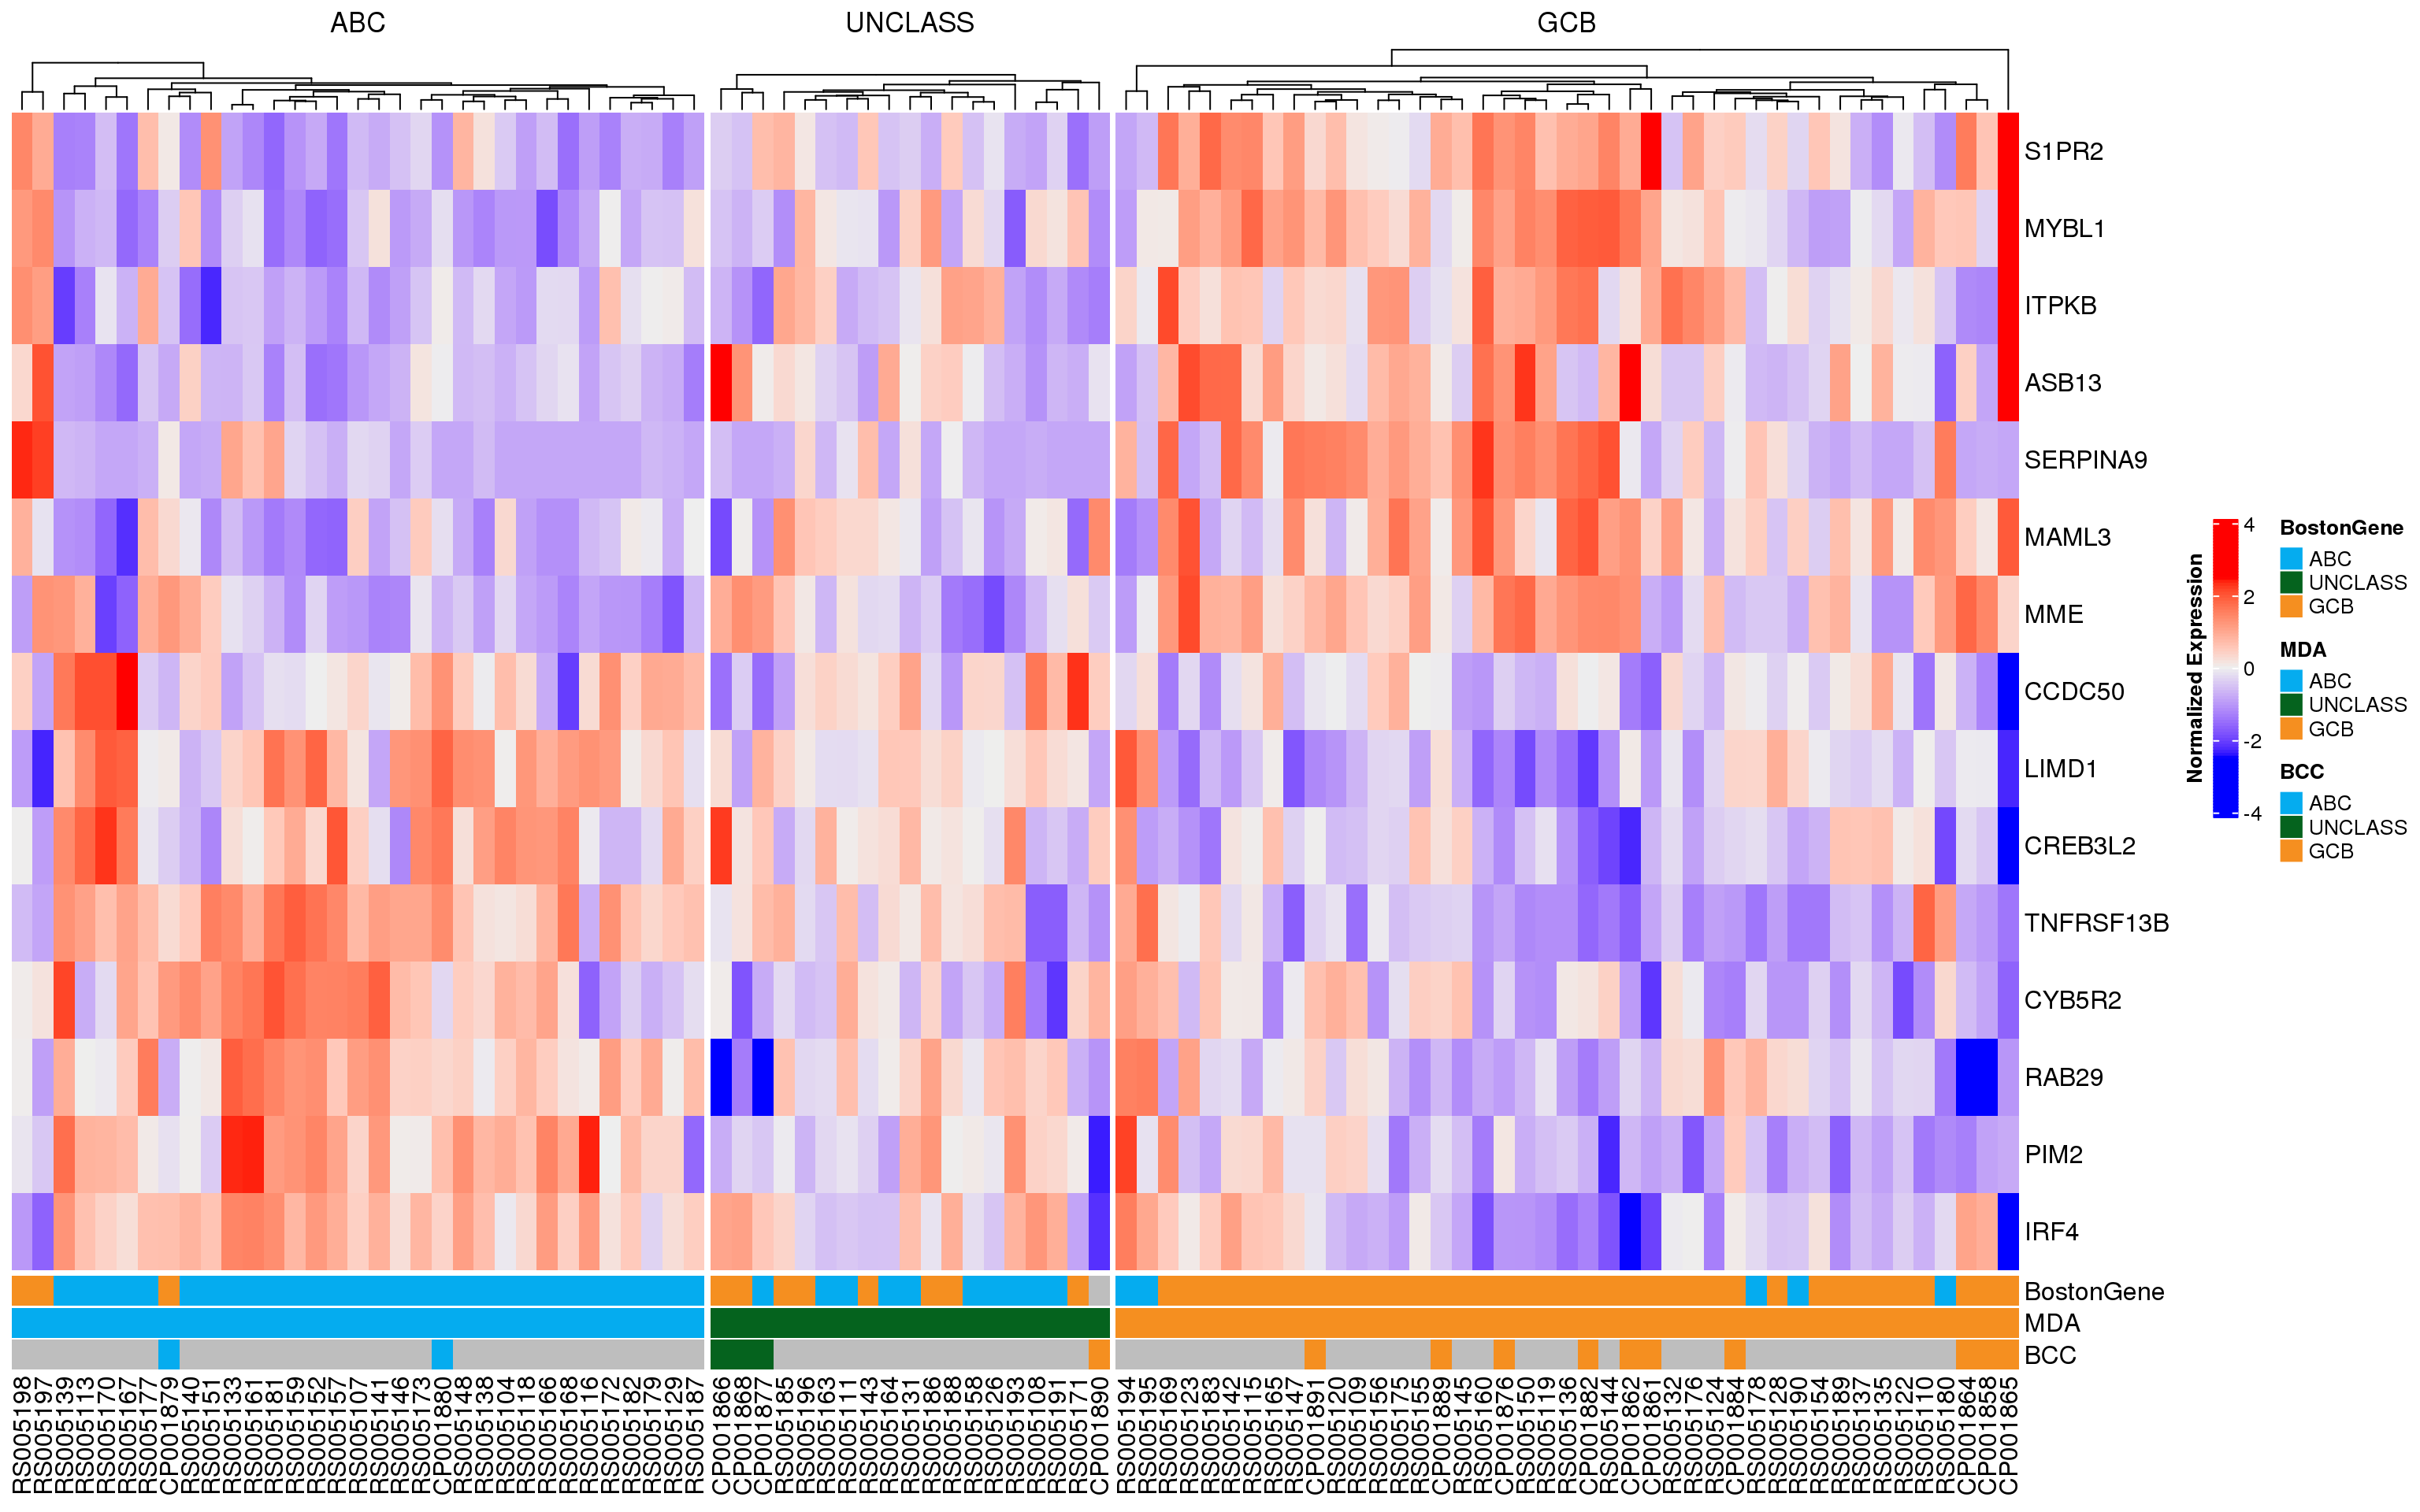
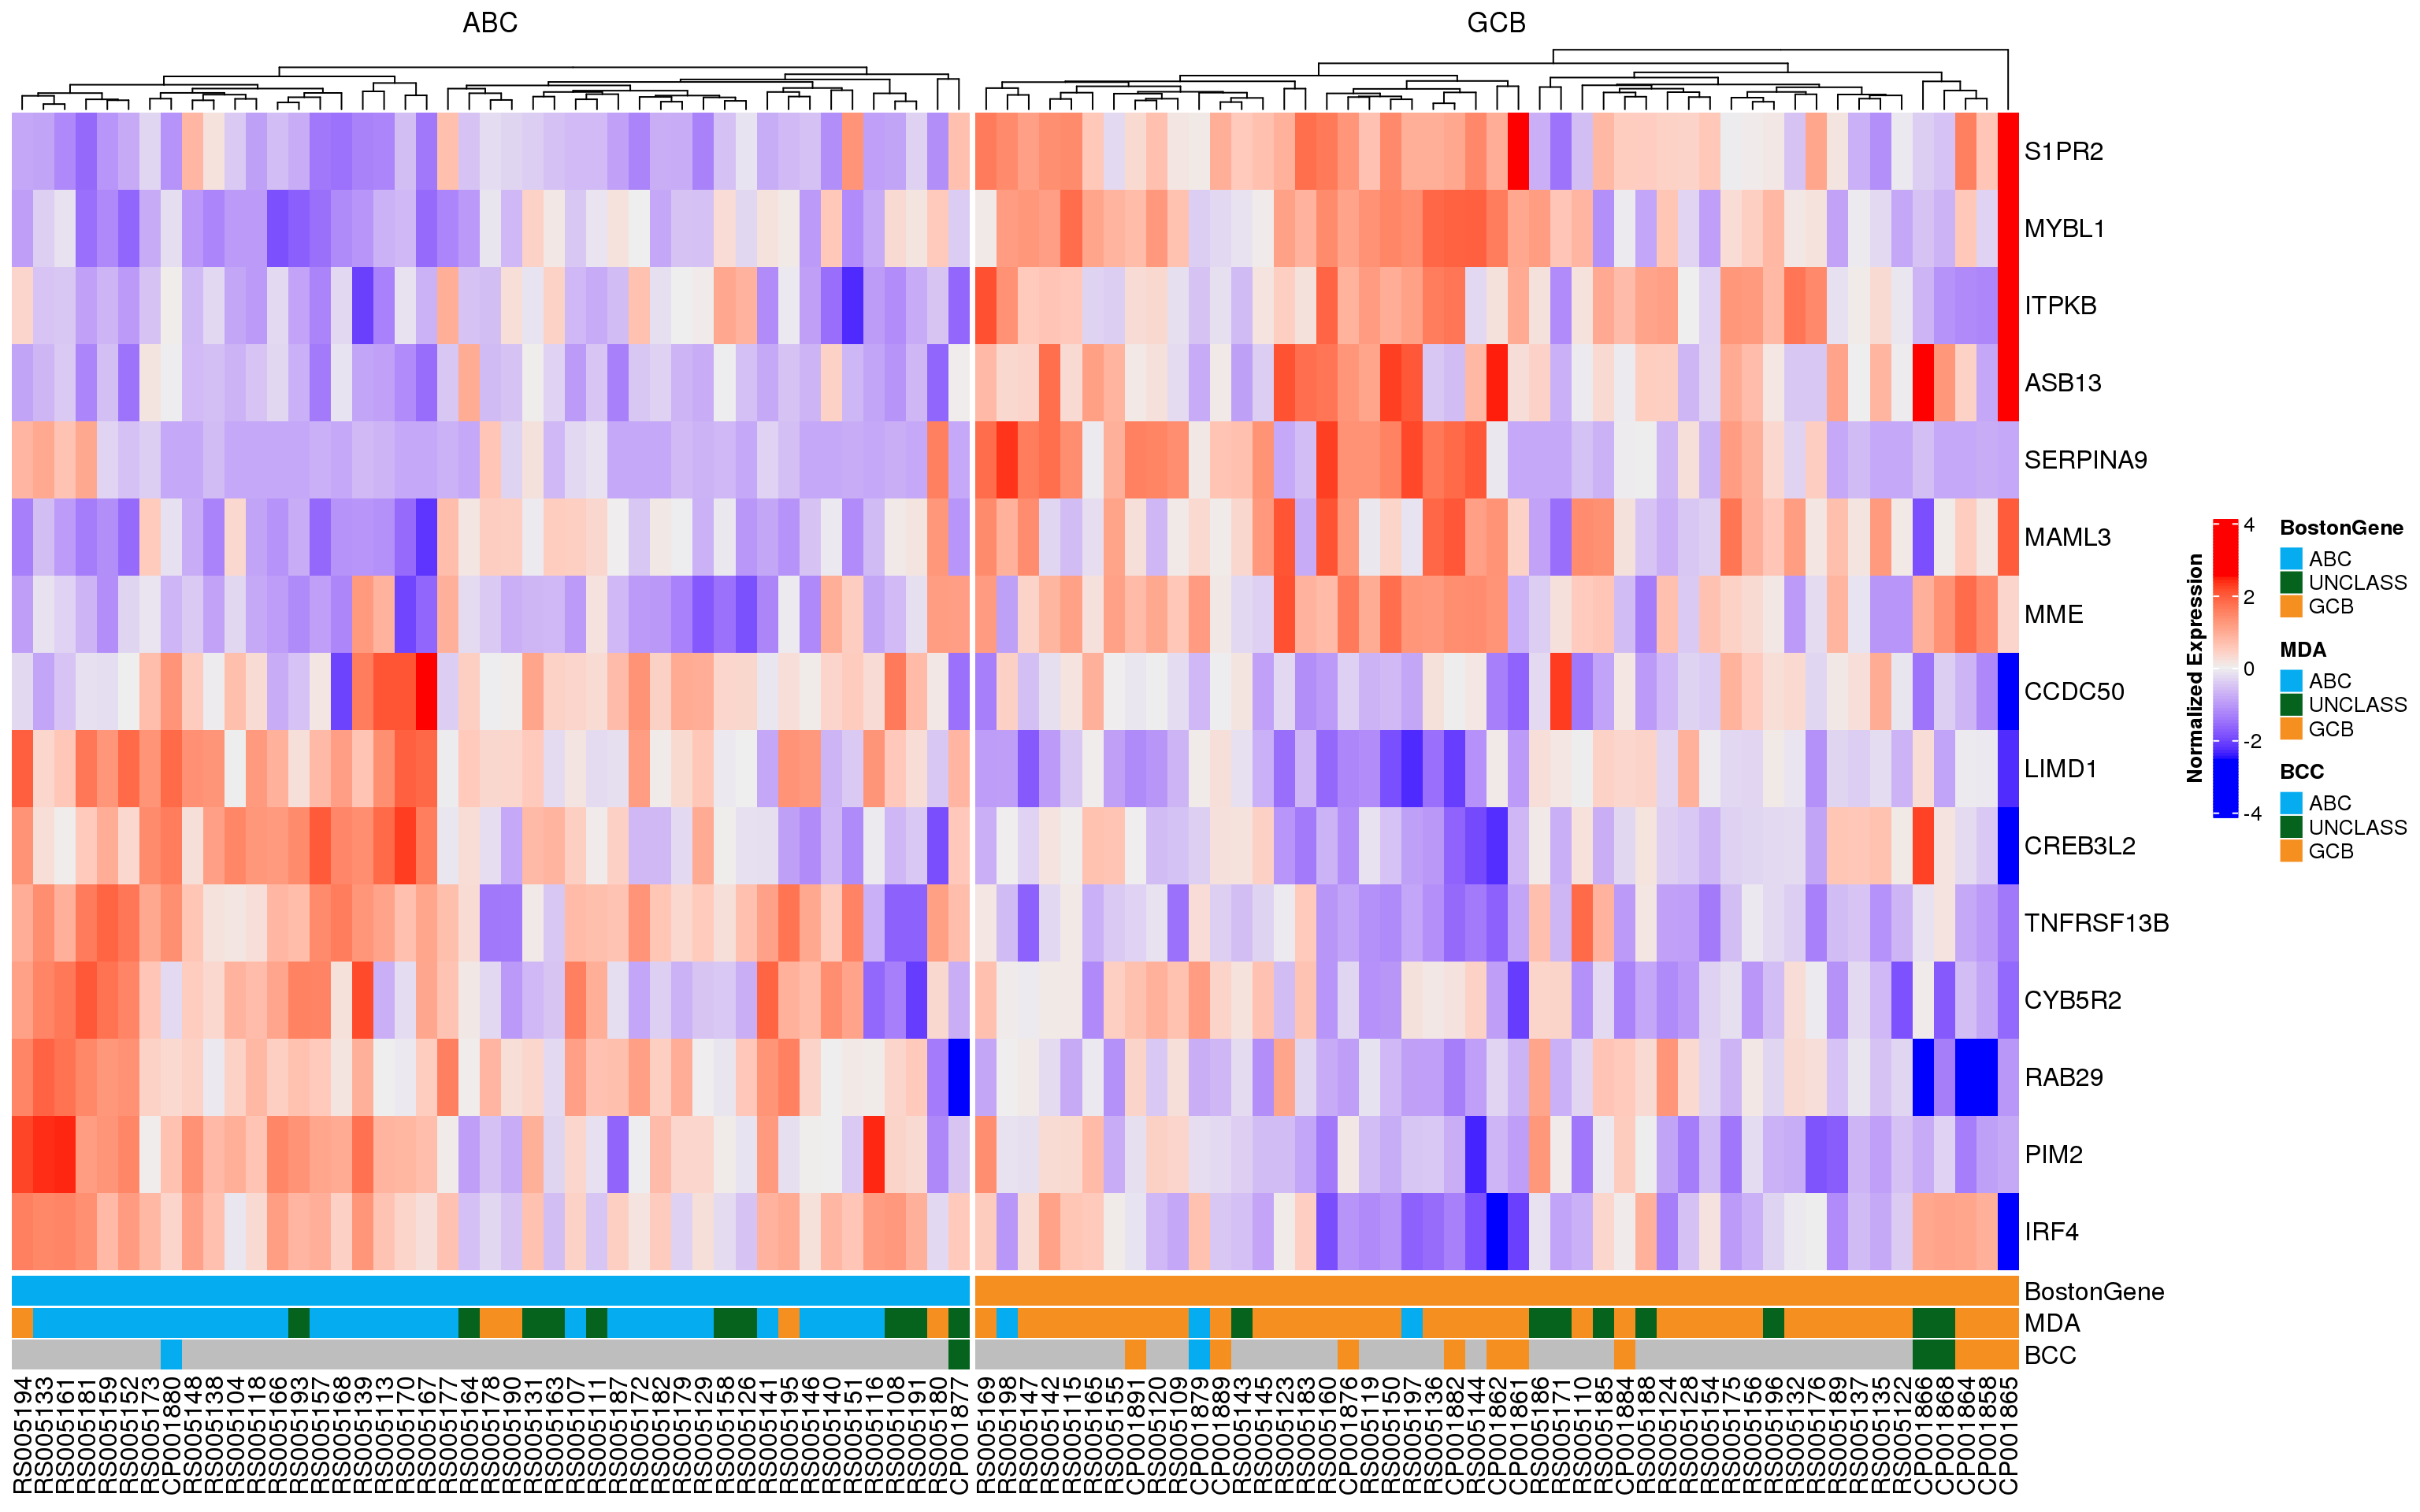
In each of the following heatmaps, the genes (rows) are ordered according to the weight used in PRPS classification. Genes at the top are more highly expressed in GCB-DLBCL, while genes at the bottom are higher in ABC-DLBCL. Figure 2 shows all 175 genes that match those used in the Wright classification method, and samples (columns) are stratified according to MD Anderson NanoString DLBCL90 classifications. Figure 3 shows the same samples, but only the expression of the 15 genes used in the NanoString Lymph2Cx assay is shown. From both of these plots, it appears that some of the frankly discordant samples (ABC to GCB or vice versa) do have the expression profile of the class assigned by BostonGene. Furthermore, the BostonGene calls did not include any “unclassified” samples - instead all samples were either ABC or GCB. These heatmaps reveal that the cases assigned “unclassified” by NanoString do not appear to have gene expression profiles consistent with either definitive class, so labeling them as unclassified is appropriate.
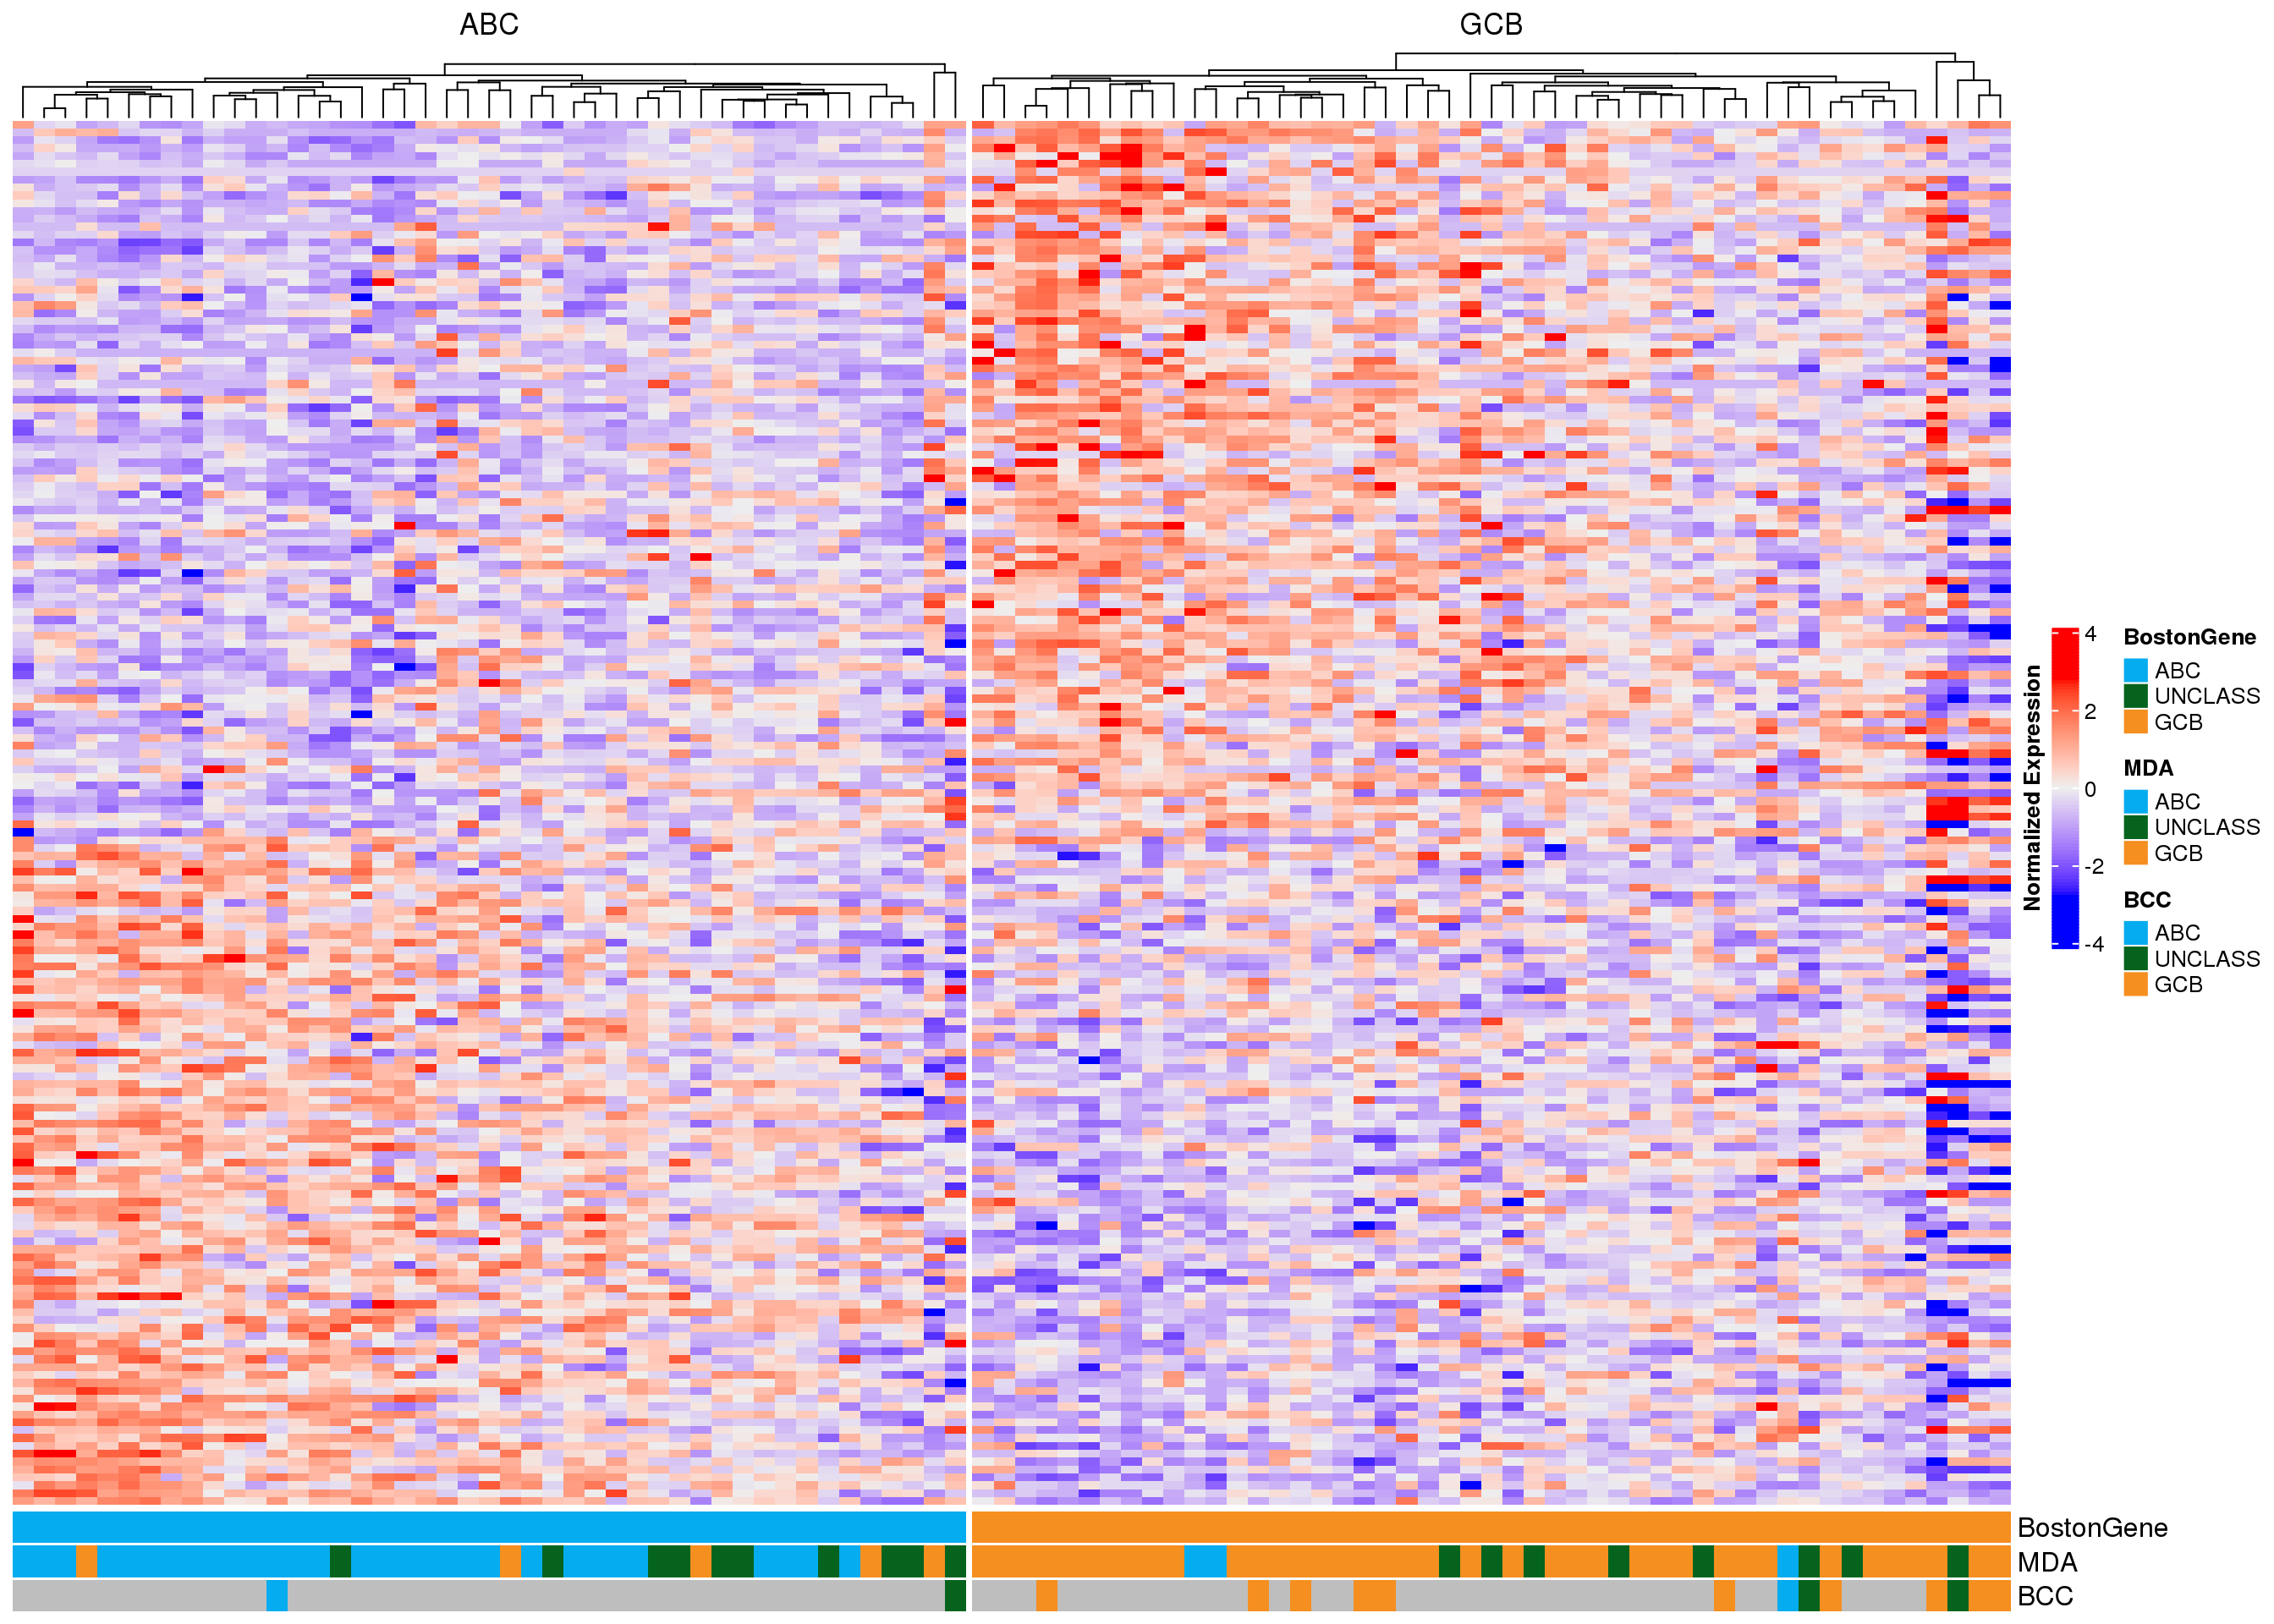
As another way to visualize the discordant samples, the heatmaps have been re-drawn, but the cases are stratified according to their BostonGene classification (Figure 4, Figure 5). Once again, it is apparent that some of the frankly discordant cases seem to have the expression profile that best matches the classification assigned by BostonGene. These results should be carefully scrutinized to ensure there are no sample swaps underlying the mis-classification. The questionable samples are RS005194, RS005195, RS005197, and RS005198.
DZsig Classification
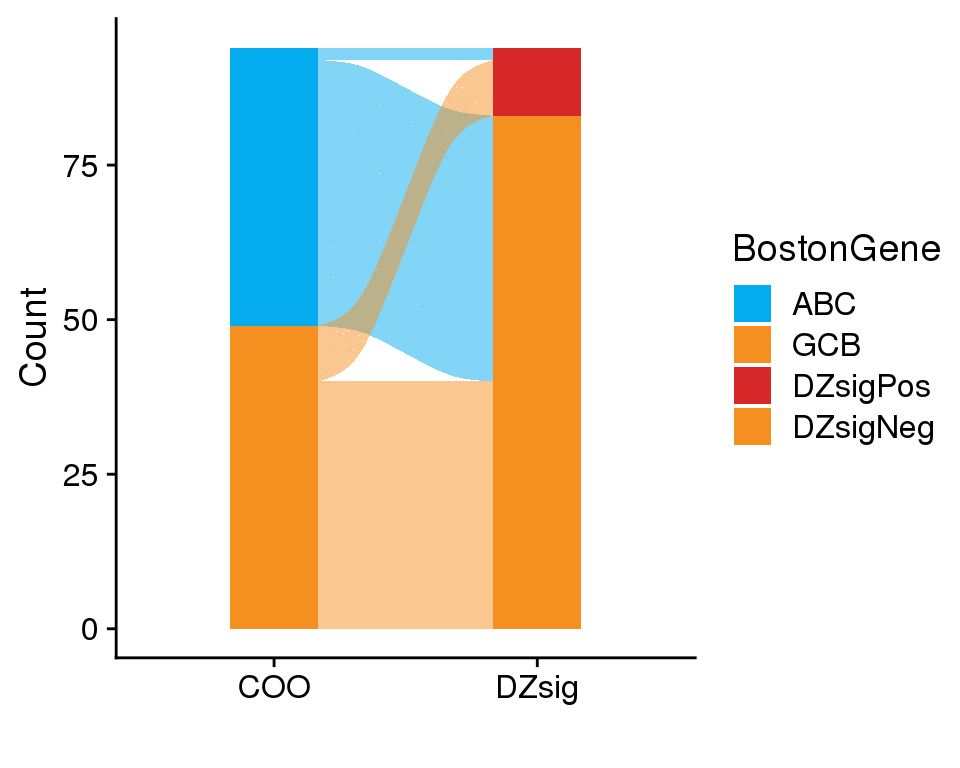
BostonGene has also produced DZsig classifications for these samples. As a rule, only samples that are GCB or UNCLASS by COO should be labeled as DZsigPos. Figure 6 shows that only four samples were classified as DZsigPos by BostonGene, and of these, one was classified as ABC.
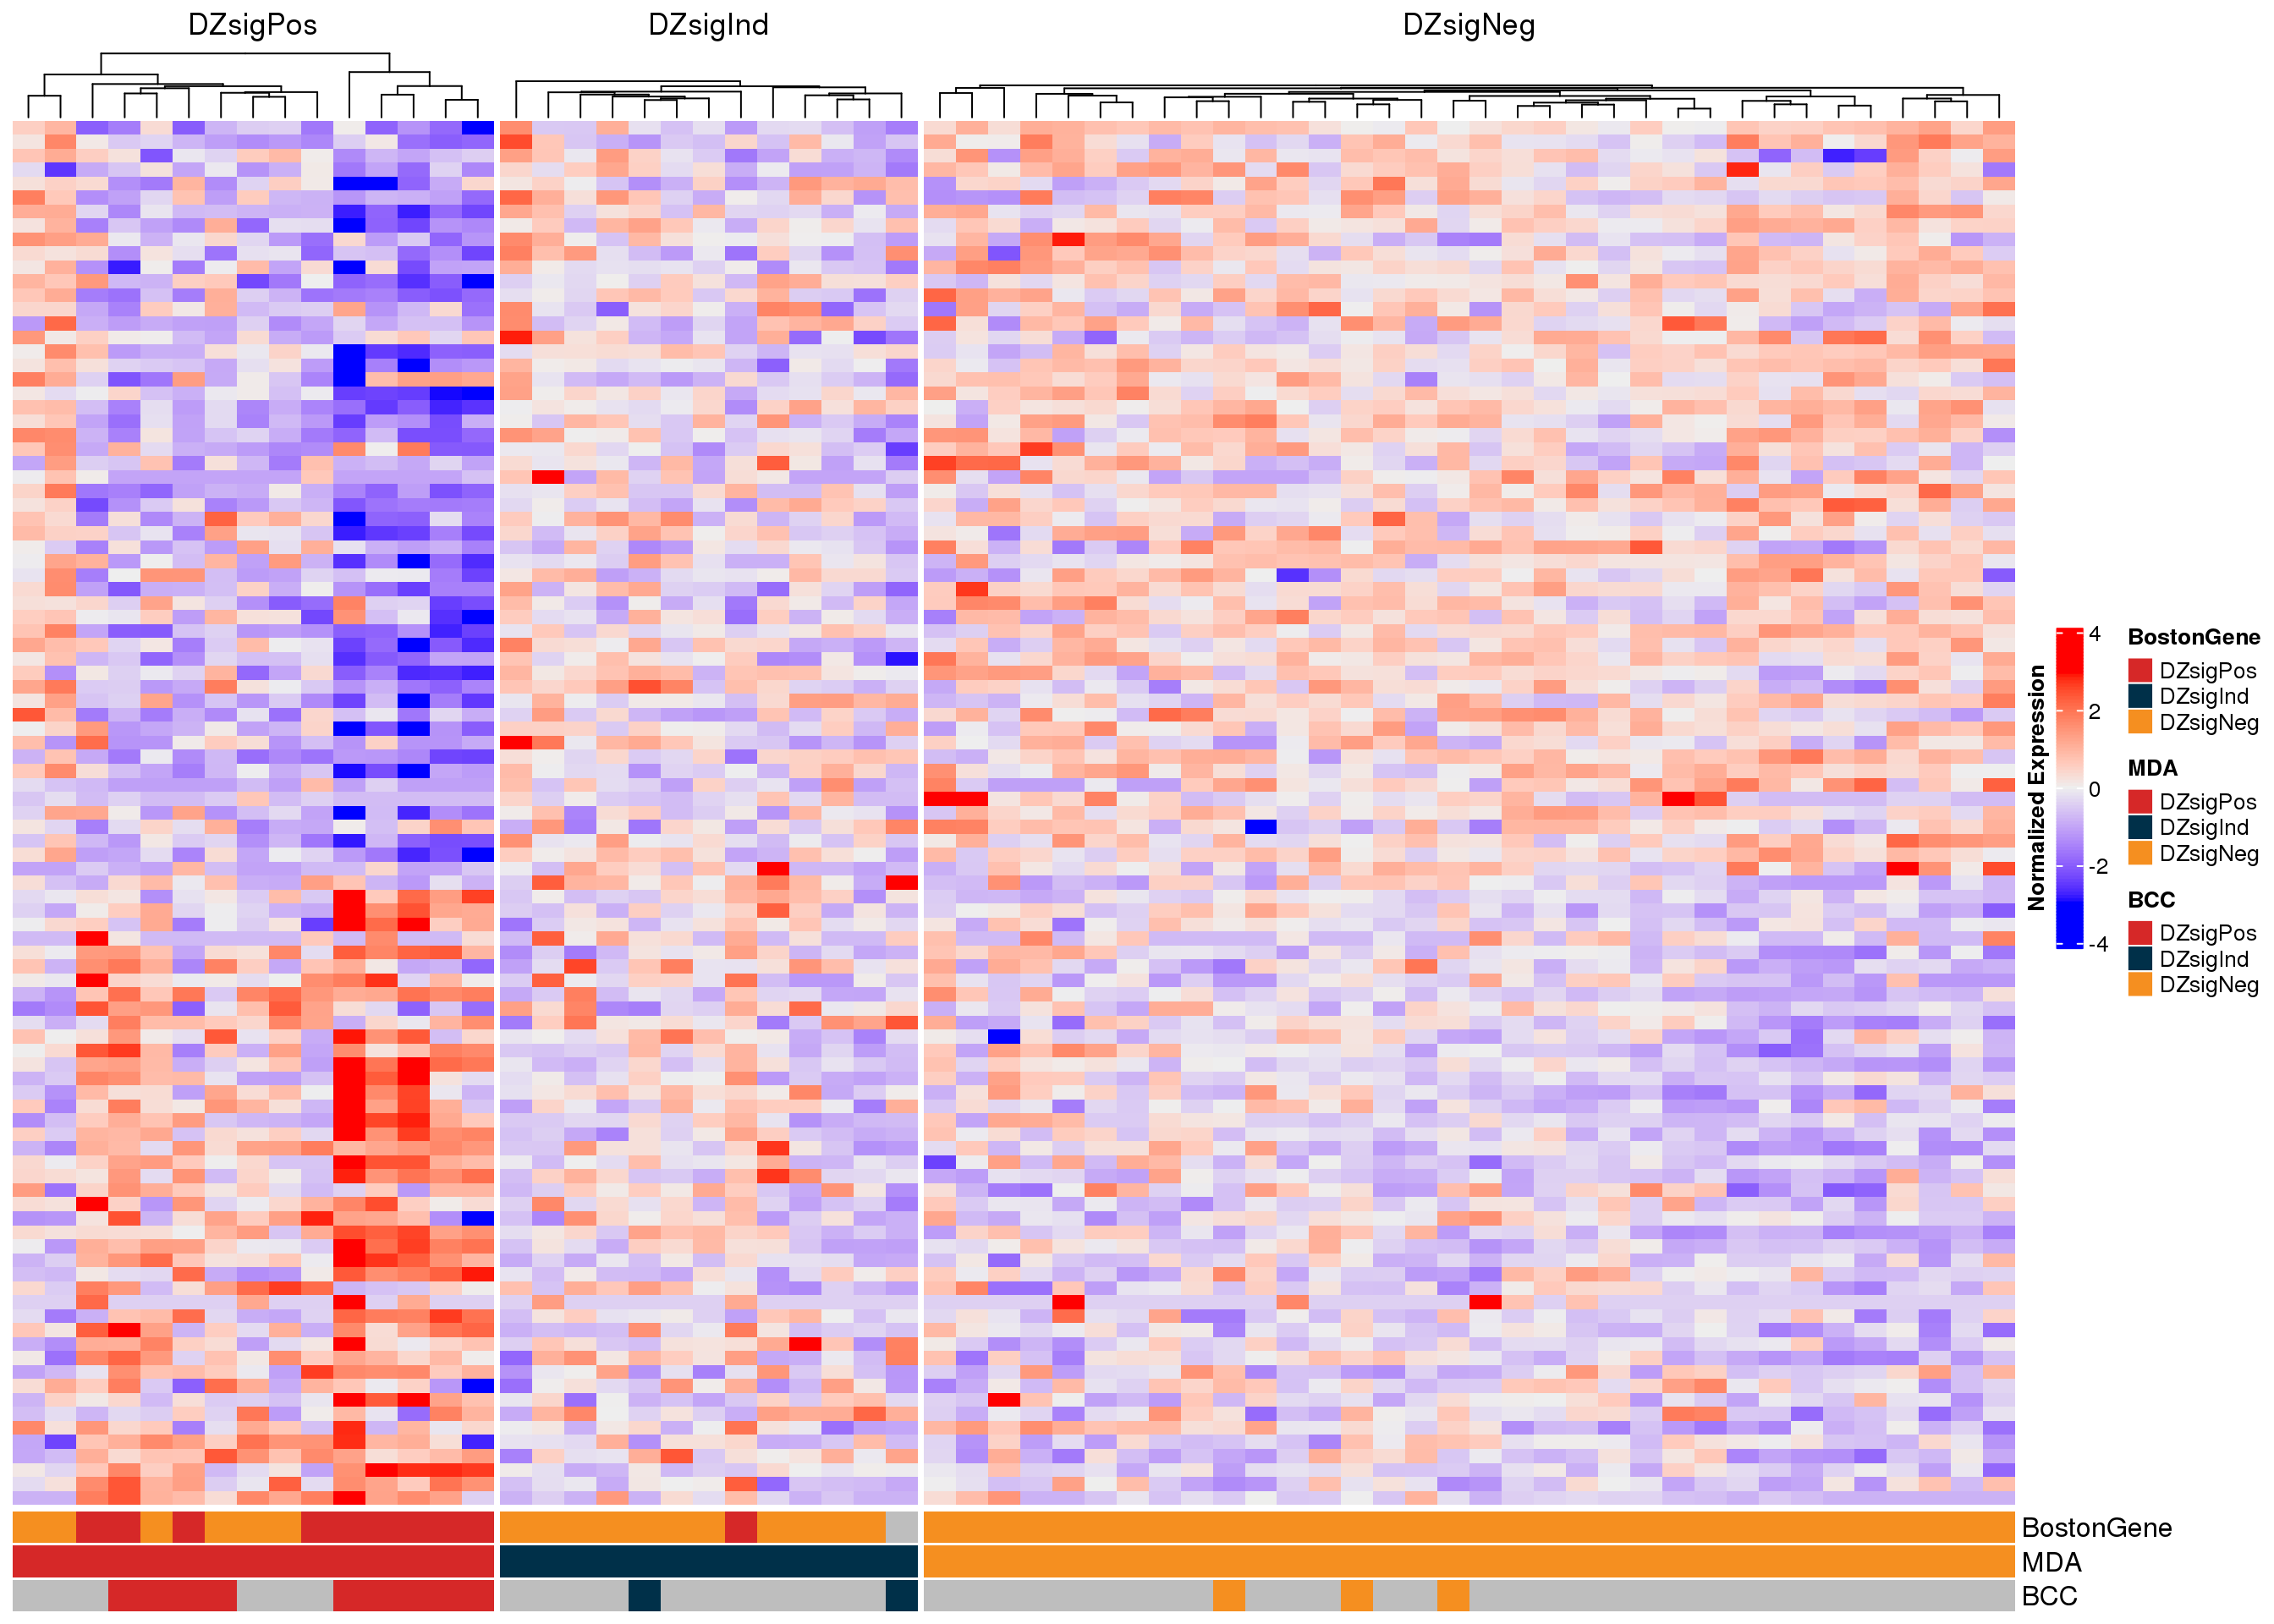
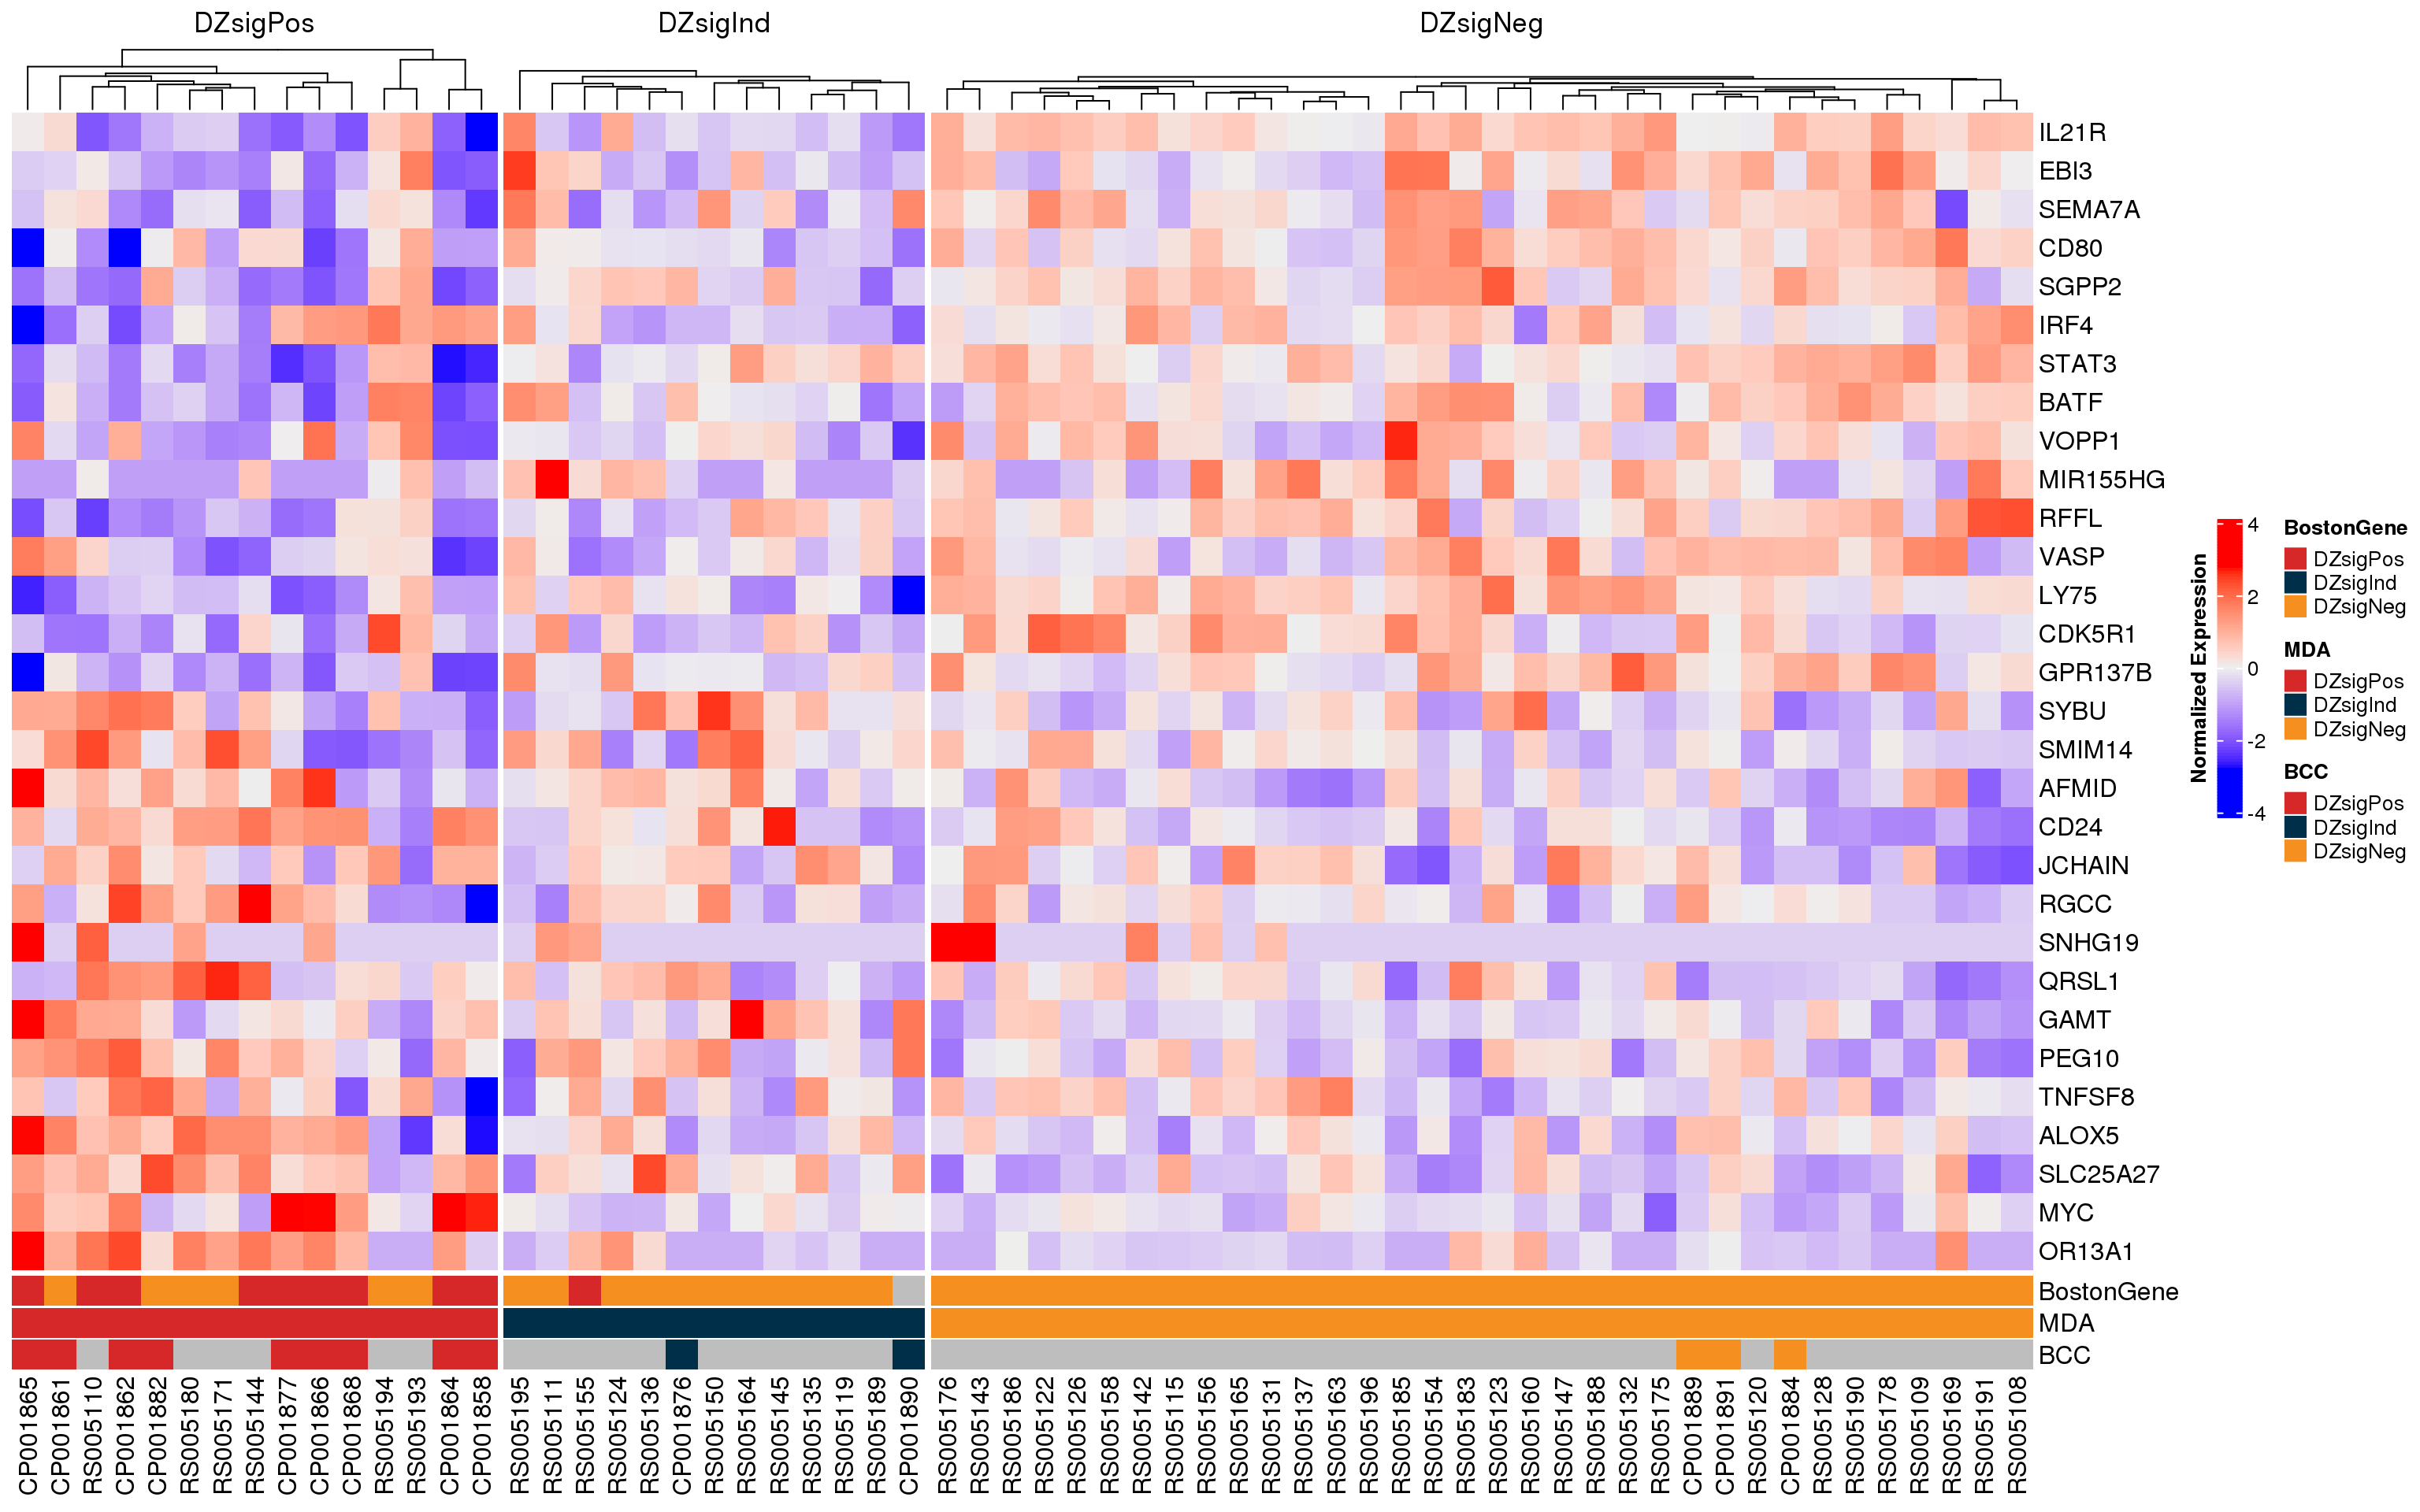
The heatmaps of DZsig genes (Figure 7, Figure 8) show a similar potential sample swap issue. At least two samples that were classified as DZsigPos by MD Anderson NanoString have gene expression profiles more similar to GCB-DLBCL. These samples (RS005194 and RS005193) should be re-examined to ensure that there are no sample swaps. Notably, RS005194 is also one of the candidate sample swaps based on the COO classifications.
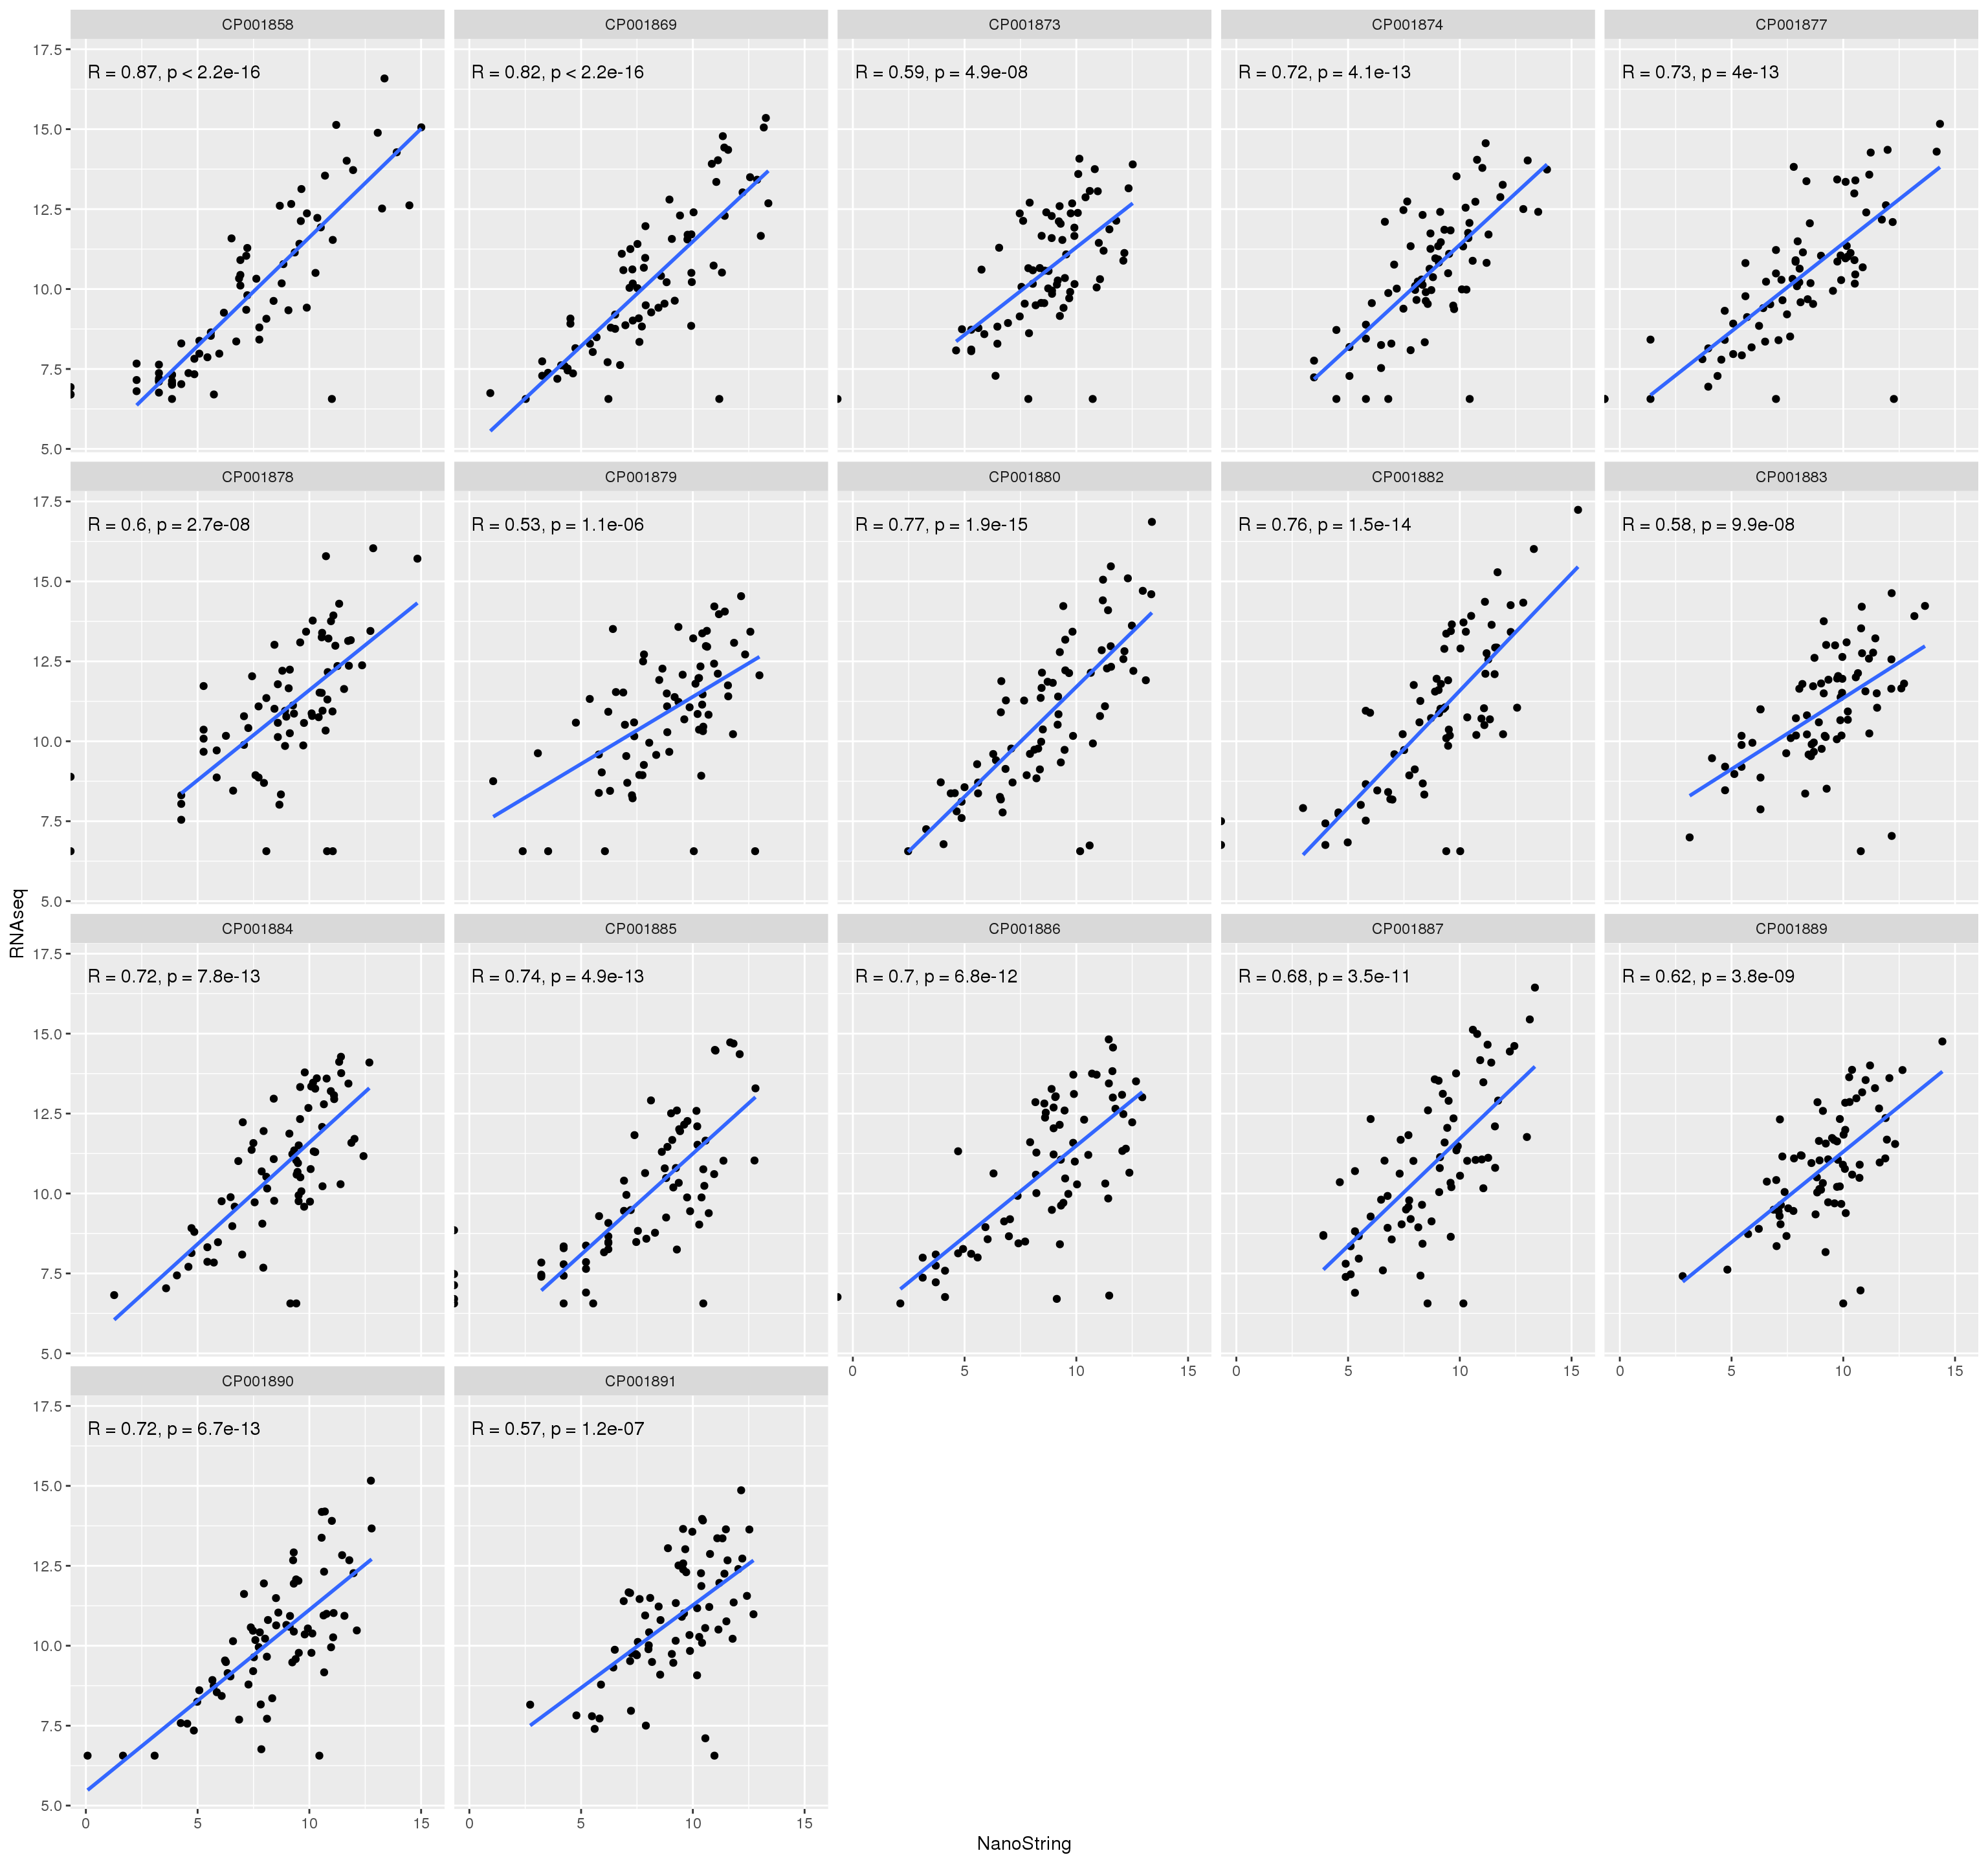
RNAseq/NanoString correlation
LymphGen
Exome data were aligned to grch37 with bwa-mem, and variants were called with our ensemble variant calling approach that reports variants called by at least three of Strelka2, LoFreq, Mutect2, and SAGE. Variants are filtered to remove those that appear in GnomAD with an allele frequency greater than 0.0001, and our custom blacklist is applied. Exome QC is performed with Picard CollectHSMetrics, which accounts for overlapping segments of paired reads to give accurate coverage estimates. Figure 10 shows that the mean target coverage ranges between 31.916823X and 267.570139X. There are only two samples with very low coverage. Overall these appear to be high-quality exomes.
Next, we will explore the agreement between LymphGen classifications run here at BC Cancer compared to those run at BostonGene. First, it’s notable that BostonGene used the “NoFus” model (without SV data) for classifications, instead of using the full model and labelling samples as negative for rearrangements (Table 1). This is not usually advisable, as the model behaves differently in the absence of data than it does when the data are negative. This should be clarified with BostonGene.
| Model.Used | BCL2.Translocation | BCL6.Translocation | n |
|---|---|---|---|
| NoBCL2CGH | Not Available | yes | 4 |
| NoBCL2Fus | Not Available | yes | 4 |
| NoBCL6CGH | yes | Not Available | 2 |
| NoBCL6Fus | yes | Not Available | 8 |
| NoFus | Not Available | Not Available | 41 |
| NoFusCGH | Not Available | Not Available | 25 |
Figure 11 summarizes the concordance between BostonGene and BCC LymphGen classifications. Since we have not performed copy number calling at BCC, we are using slightly different models and the A53 class cannot be called by us. Reassuringly, all of the cases called A53 by BostonGene were called Other by BCC, and these represent the majority of cases that were classified by BostonGene and called Other by BCC. However, a fairly large number of cases that were classified by BCC are Other by BostonGene.
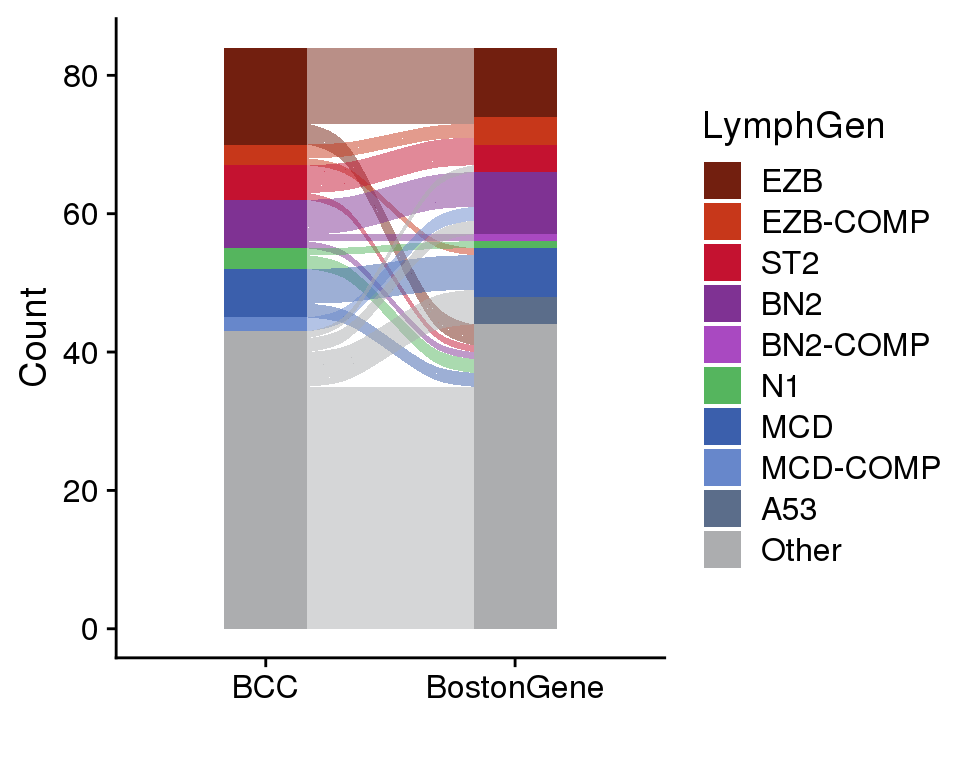
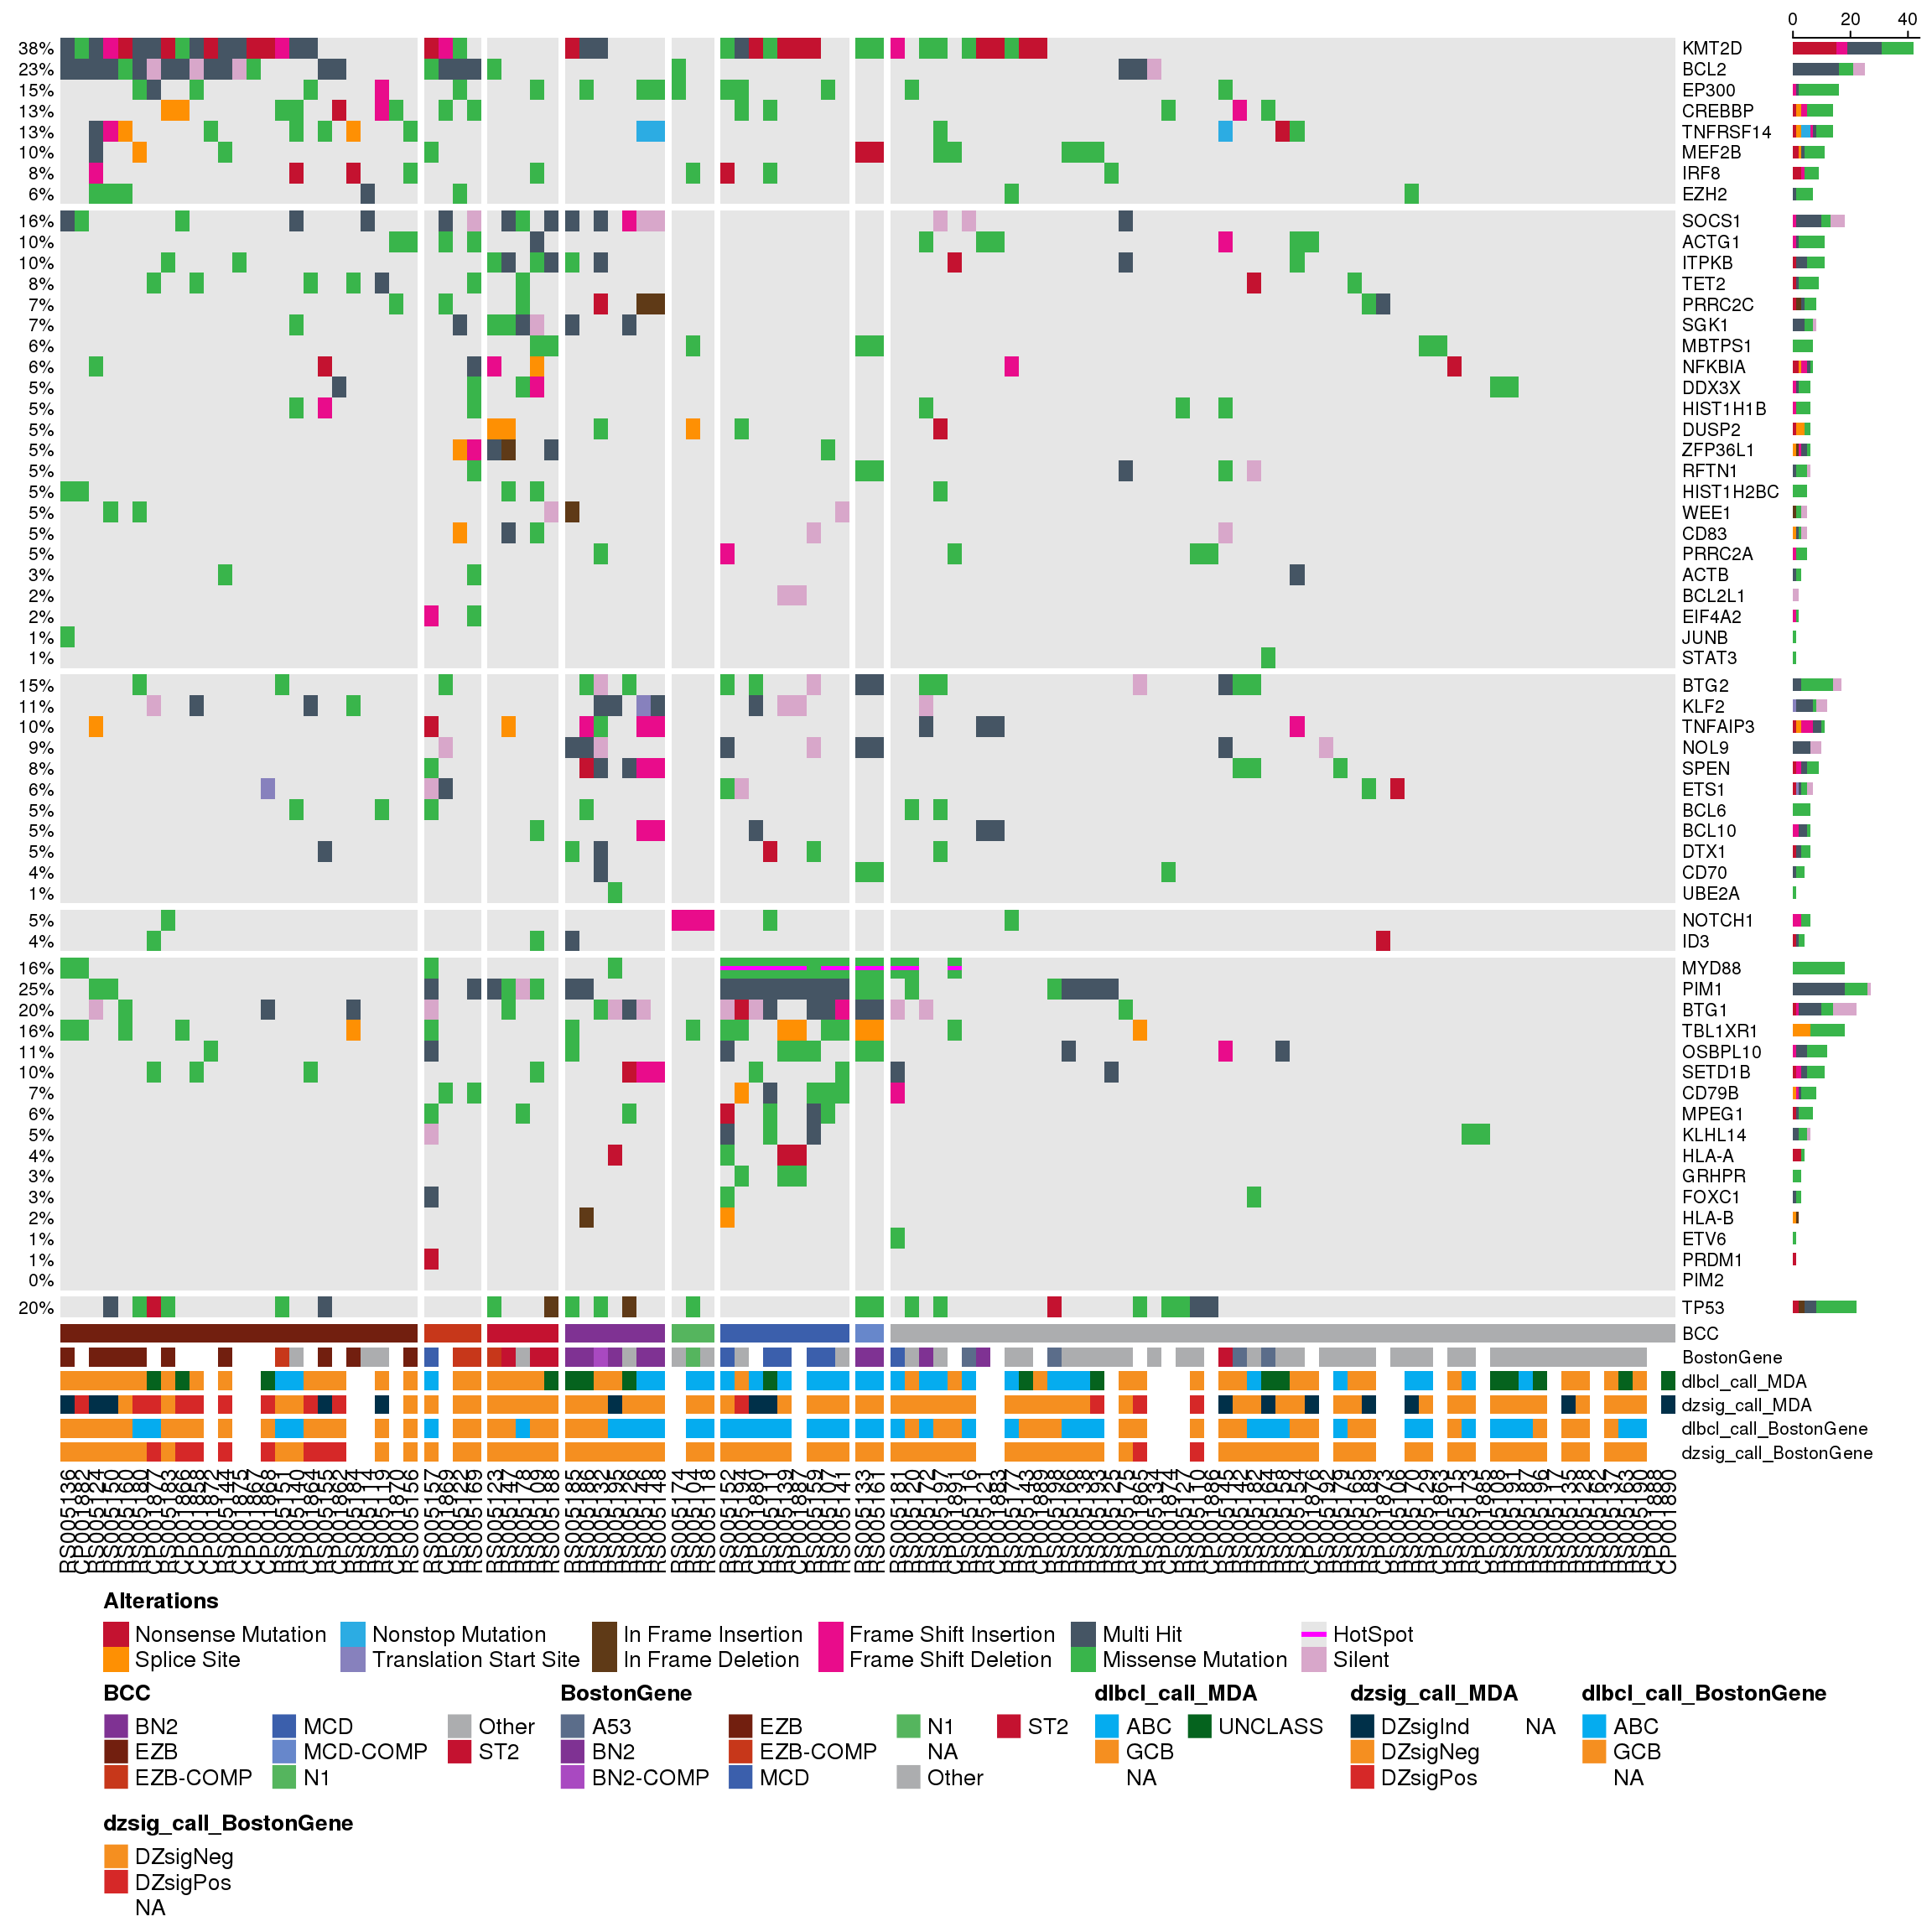
Figure 12 shows the oncoplot of mutations that contributed to LymphGen classification. This figure shows that generally the mutation patterns of samples match the classifications given by both BCC and BostonGene. However, there are some observations that should be further explored:
- The two samples classifed as MCD-COMP by BCC (RS005133 and RS005161) have identical mutation profiles. Their NanoString and RNAseq-based classifications are also all identical. Are these from the same patient/tumour?
- There are two samples classifed as BN2 by BCC and BostonGene (RS005146 and RS005148) that have very similar mutation profiles. Are these from the same patient/tumour?
- There are 3 samples (RS005118, RS005174, and RS005104) with NOTCH1 truncating mutations affecting exon 34, a defining feature of the N1 classification. However, only one of these (RS005104) was classified as N1 by BostonGene.
Conclusions
The BostonGene RNAseq and exome data appear to be high quality. This analysis has raised several concerns about potential sample swaps due to discordance between NanoString classifications and the gene expression profiles shown by RNAseq. There are also some concerns about the robustness of variant calling and LymphGen classification by BostonGene, most notably regarding the samples with NOTCH1 truncating mutations that were not classified as N1.